The government reported an economic contraction of 34% in the 2nd quarter of 2020 and I’m not so sure how they came up with that. Using the U.S. Bureau of Economic Analysis’s (BEA) raw datasets the annualized change from Q1’s $19.0 trillion economy to a $17.2 trillion economy in Q2 calculates to a contraction of 38% in Real terms, not 34% – a reporting error of more than ten-percent.
That’s government accounting for you. Look for a major revision with the second estimate due out in a few weeks.
Broad market inflation can be defined as the difference between Nominal GDP (also called Current Dollar GDP) and Real GDP. Real GDP calculates current market activity using prices chained to a particular prior year. The BEA currently uses 2012 prices to arrive at Real GDP, which presents a clearer view of growth because inflation, the general rise in prices, can easily be confused with growth. Real growth is activity based. For this reason Real GDP is the most widely reported number.
For example, last year current dollar GDP (a.k.a. Nominal GDP) recorded 4% annualized growth. But that rate includes inflation (price growth) as well as activity growth. Real growth strips away the change in prices. Real GDP for that year, which calculates 2019 market activity with 2012 pricing, posted a 2.2% growth rate in activity, which is also known as Real growth. Inflation, therefore, was 1.8% in 2019 (4% – 2.2%), slightly higher than the post-crash average (1.7%).
The numbers reported by the BEA are quarterly figures that compare the current quarter versus the prior quarter (i.e. Q2 is compared to Q1) and the change is then annualized, or multiplied by 4 to arrive at figures for a calendar year.
Quarter verses prior quarter is a helpful measure indeed, but as the year rolls on it gets easy to forget what happened in prior quarters. A clearer view of a year’s activity is had by comparing the current quarter’s annualized activity to the prior year’s, thereby showing real growth (or contraction) year-over-year. Using that metric Real GDP is actually down 43% on an annualized basis through the first two quarters of 2020.
To show the math, the first quarter actually shrunk by 1.26%, which once multiplied by 4 to annualize returned a 5% annual rate of contraction. The second quarter actually shrank 9.5% in Real terms, which translates to a 38% annualized rate (together 43%).
But quarterly rates of change vary greatly, and to assume that a quarter’s rate of change will be followed by three consecutive quarters with the same mathematical delta is an exercise in futility. Reality simply doesn’t work that way.
What we know is that when the free market is quarantined the last two weeks of a single quarter it produces 1.26% less market activity, or $274 billion less spending than what occurred the quarter before, when things were at a post-’08 crash normal. The quarantine, not the virus, cost the economy $274 billion in lost activity (spending) because as we now know the virus had been around long before the quarantine was ordered, dating back to the fourth quarter of 2019.
The central government responded to their market shutdown with an initial $2.2 trillion spending package to plug the economic hole. Even they knew the first quarter shortfall was only the beginning.
We also know that when governors turn themselves into kings and completely strangle the free market with mandated business closures and significantly reduced capacities for an entire quarter, as they did in Q2, such actions produced 10.6% less in current dollar economic activity, or $2.3 trillion less than the quarter before Trump cast the shelter in place mandate.
The economy is down 10% because the government reduced the Market’s size, capability, and potential. That condition won’t change – and can’t change – until the government reverses the policy course that halted growth and threw the economy into recession in just two short weeks in March, which then escalated into a full blown depression just three months later.—And no one is talking about it, because as mentioned in prior blogs, it’s all about Q3.
Q1 and Q2 were expected. The caveat has always been Q3 – the rebound – what shape will it take?
One month into the third quarter we know that things are only slightly better than Q2, if at all. Restrictions are still widely in place in many sectors of the economy and each governor is playing the same game by their own terms and set of rules, regardless of fact, science, constitutionality, or well-being. Management of the economy far and wide looks chaotic, incompetent, and dysfunctional at every level of government. It’s amazing that the market has only shrunk by $2 trillion up to this point – and that’s a startling statement considering central governance injected more than three times that amount to minimize the decline (including direct stimulus injected by the Federal Reserve).
People are moving and housing is hot, especially in the suburbs. Interest rates remain at all-time lows, and together with heated demand is a recipe ripe for inflation. But appraisal measures instituted after the ‘08 financial crisis are keeping housing prices tight, slowing the pace of inflation, and corralling associated levels of debt. Banks are flush with cash, of course – and stocks too – thanks to a recent $5 trillion injection of new money via QE from the Federal Reserve.
More than 21 million Americans remain unemployed and while the unemployment rate has dropped from its Covid peak of 14% it remains incredibly high at 10% – greater than any point during the last major crisis. Labor participation, which never recovered from the Great Recession, plummeted to 60.2 from its pre-crisis high of 66.4, before rebounding weakly to 61.4.
The American market remains under extreme duress. Investors must take note.
A slightly deflationary condition was experienced in Q1 where Real GDP slid faster than Nominal GDP, suggesting more goods were sold for less dollars. That was something that could have been expected due to the shock and awe inflicted on supply chains with production shutdowns and restricted capacities, not to mention consumer demand being forced into quarantine. That condition reversed itself in Q2, where broad market inflation reached the Fed’s 2% target, slightly higher than the 1.7% post-crash average.
If printing trillions of dollars of new money and laundering it through the Wall Street establishment could not create broad market inflation then the government’s response to Covid-19 certainly will.
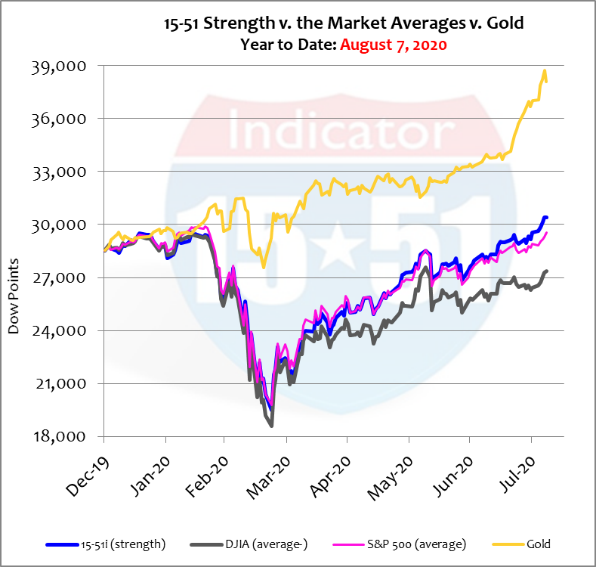
Every major policy move put forth thus far has added significant costs to the production of goods. New regulations added labor and compliance fees, reduced capacities increased fixed costs per unit, and exorbitant unemployment benefits raised the cost of labor to entice employees to return to work – all of which has no alternative but to find its way back to consumers in the form of higher prices (a.k.a. inflation). And that is the reason gold has been running strongly this year.
Gold is the proverbial “gold standard” for inflation indication, it is up a sharp 34% this year. Should the gold market be correct and higher inflation is indeed on the horizon, say Q3, the news of its arrival will shake the world because it will force yields higher against the will of central bankers located at all four corners of the globe.
Higher yields in the face of a global economic depression, massive and widespread unemployment, and spiking inflation, will only produce higher default rates which will drain liquidity from the system – and not just for America. The entire world has been infected by QE and Covid alike.
Printing more money (via QE) to replace lost liquidity under that Market condition will only create greater costs, more inflation, higher yields, and more defaults. Then add another flu outbreak with this year’s novel coronavirus (Covid-19 was last year’s) into the equation along with a heated Trump v. Biden campaign season and what a hellacious mess the world will be.
What will government policy look like in the face of such conditions?
And there my friends is the global quandary that will drive stock prices lower.
If the market were allowed to operate freely with Covid-19 in it then the impact to the economy would have been strictly related to the virus. But that wasn’t the case. Government policy, not Covid-19, impaired market dynamics and fundamentals to a point of oblivion. To blame the virus for our economic woes is like blaming the gun for murder.
The U.S. economy is off 10% from where is was before Covid-19 because the government significantly changed market dynamics in its advent, and that condition remains is full force and effect today. Business models have been forced to change everywhere and prices will soon follow – and that is when the Wall Street establishment will suddenly wake up at the wheel and scream SELL.
And it will feel like déjà vu all over again.
But right now stocks are up, depression or not.
Gold is better, and should remain so into the foreseeable future.
Stay tuned…
![]()
We are doomed. No one is going to be able to fix the total fiscal mismanagement by multiple administrations. Hold on for the big one that’s coming
Right, Craig, there’s a big one coming.