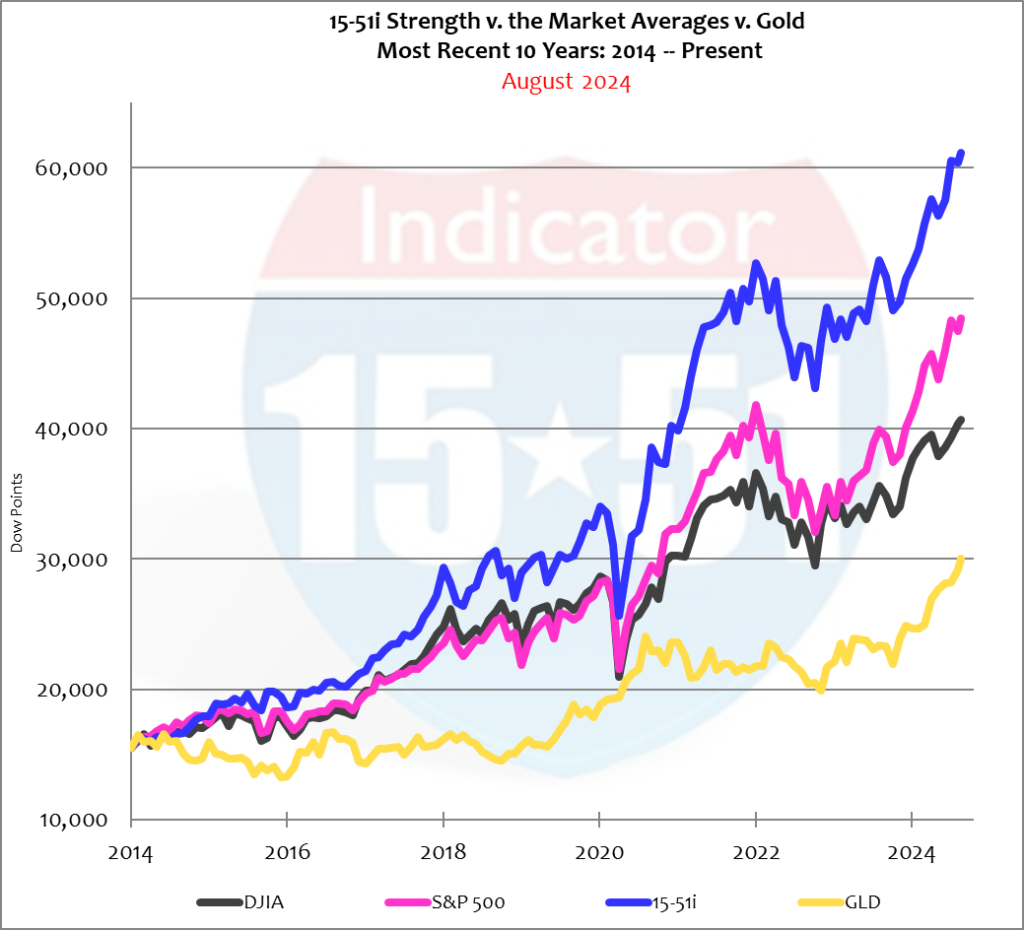
As revealed in LOSE YOUR BROKER NOT YOUR MONEY, the 15-51 Indicator (15-51i) is a market portfolio designed and constructed to indicate how stock market strength is performing. To be successful the portfolio must outperform the Dow Jones Average while moving in a “market-like” manner, which it reliably does (see above.)
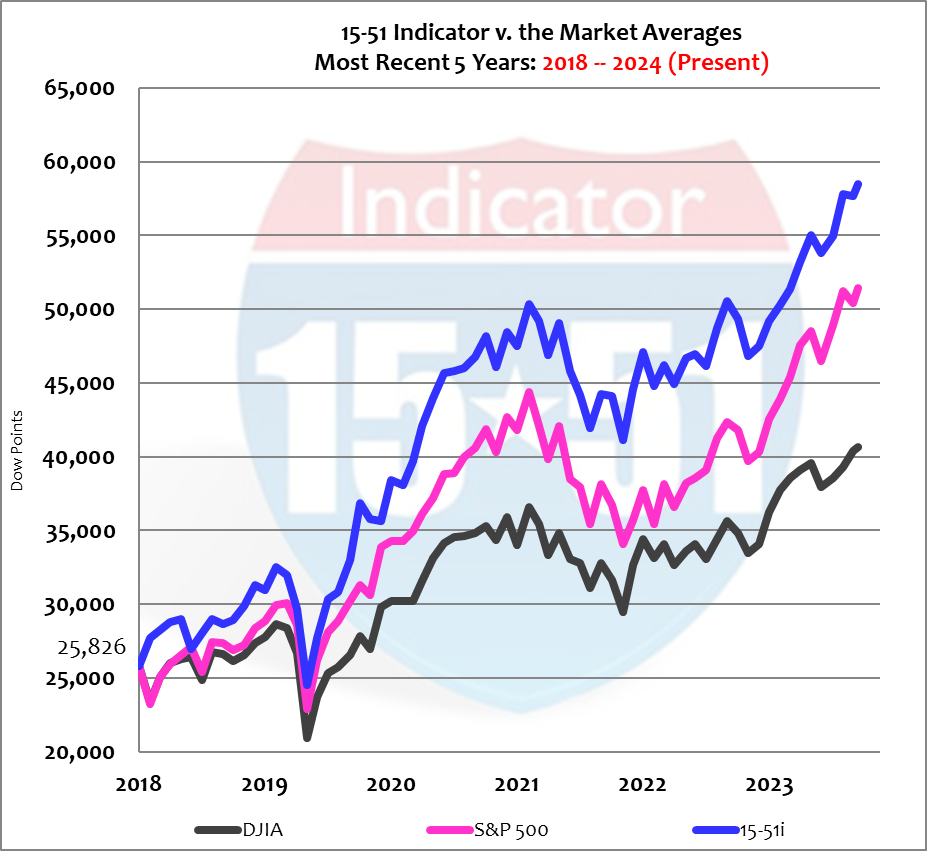
The 15-51i consistently outperforms the Dow and S&P because it is a stronger portfolio than they are. It achieves its dominance by utilizing superior 15-51 design and my stock selection method. (See my book for a full demonstration.)

Knowledge is the foundation of success. Dan’s method is grounded in basic logic and common sense, and is backed by history, fact, and mathematic. It’s easy to understand, simple to use, and consistently produces superior results. Guaranteed.

See the performance you can expect with the 15-51™ system! Dan’s portfolio routinely outperforms the markets by more than 600% over the long-term – and you can do it too! Click on the image to see the proof.

Dan makes good on his chapter 8 guarantee by personally connecting with his readership to answer questions and coach members through the investment process.


