Introducing 2.0
At the beginning of the year I began writing my next literary effort, and as stated on the back cover of my first endeavor, “Don’t expect to see a sequel. Lose Your Broker Not Your Money has it all, including an unparalleled guarantee of performance and support via a totally free website…” In other words, everything I have to say about investment is contained in that book and on this website. There’s no room for a sequel.
So while my next publication will not be an investment book per se, it will be closely connected to markets, people, and success (hey, you can’t change a leopard’s spots.) And the one thing that is consistent with those three nouns is change, which happens to be a major theme in my next book – and the topic of this blog.
Up until now I have refrained from changing the make-up or balance of the 15-51 Indicator because it has continued to indicate stock market strength and above-average stock market performance. However, times have changed, things have changed, and “the market” has changed. In fact, the Dow Jones Industrial Average has changed so significantly since the last major correction that the 15-51i can no longer be considered a “market portfolio.” Its current make-up is just too different than “the market’s.”
Now it cannot be said that I haven’t thought about changing the Indicator before. I have, many times. As a matter of fact I’ve had an updated “version 2.0” portfolio built for several years. But I never pulled the trigger. Allow me to explain…
Some of the most important lessons I tried to demonstrate in LYB are that successful investment follows basic logic and common sense; that it is not hard to do or understand; that patience is a virtue, and that there is absolutely no need to micro-manage and fiddle with your portfolio every time “the market” makes a move with some chutzpah.
Indeed my approach is much different than the Wall Street establishment who attempts to convince people that they are too stupid to invest their own money successfully, and that successful investment requires minute-by-minute management, by teams of Ivy Leaguers with decades of Wall Street experience, and split-second executions.
That’s total BS, and nothing more than a modern day version of the high-pressure sales tactics that inspired Martin Scorsese to chronicle Jordan Belfort’s stockbroker life in THE WOLF OF WALL STREET, a disgustingly accurate portrayal of that seedy business – and the exact kind of treachery that inspired me to write LOSE YOUR BROKER NOT YOUR MONEY.
Investing successfully requires only 5 things: basic math skills, common sense, the experiences of your life, a copy of my book, and the will to do it. That’s all.
LOSE YOUR BROKER debunks every high-pressure sales pitch that has come out of Wall Street before Jordan Belfort stalked prey. The LYB method is easy to understand, simple to use, and produces dominant performance results. The long-term track record of success for the 15-51 Indicator is proof of its effectiveness; it hasn’t changed once in almost twenty years and yet it beat “the market” by more than 550%.
The 15-51 method is incredibly durable. But that doesn’t mean change isn’t necessary, or warranted. It is, and it’s for the 15-51 strength indicator to do what the Dow average has already done several times since the ’08 crash: rebalance and restructure.
I have one more point to make before moving forward. Some have suggested that I shouldn’t change the 15-51 Indicator in fear that the book might become obsolete, outdated, or insignificant. I don’t buy into that one bit. Nothing on this website, no piece of information, fact, or advice, can diminish the value and worth of the LYB book. The 15-51 method is a unique and innovative approach that is proven to work – and success never goes out of style. That makes it a timeless piece. In fact, the only reason LYB isn’t a household name is because it hasn’t been properly advertised or marketed. That’s my fault, not the book’s content.
LYB was self-published by me, and along with the costs of running this website as part of my chapter 8 guarantee, represent a significant investment for me. And unfortunately every time advertising and marketing got to the top of my priority list something more important operationally came up. That happens – especially when working at the grassroots of business and investment. (Did I mention that patience is a virtue?)
That said, a substantial investment in technology is required for me to update the 15-51 Indicator page of this website, and while I have sold my share of books, it isn’t enough to justify that level of investment – certainly not before proper investment is made in marketing and advertising. Besides, I can easily update the 15-51 strength indicator using charts prepared in Microsoft Excel and then presented in this blog area. So that’s what I’m going to do.
Redefining Strength
Restructuring the strength portfolio opens up a new dimension in chart analysis. Comparing the trend-lines of two 15-51 portfolios (a static portfolio that remains unchanged versus one that was rebalanced and restructured) will provide the reader a two-sided picture of strength – a dynamic one and a static one.
Two quick notes about rebalancing and restructuring: everyone has their own way and time of doing it; and there is no one right way to do it.
My approach stands on the side of this basic logic: Knowing that the formula to profit is buying low and selling high, then it is only reasonable to over-weight in stocks when they’re low and to under-weight in stocks when they’re high. As such, there are three actionable points to rebalancing: when stocks are “high or low”, and when they are at “fair value.”
I use the action zone to gauge those classifications. Here’s a look at it again.
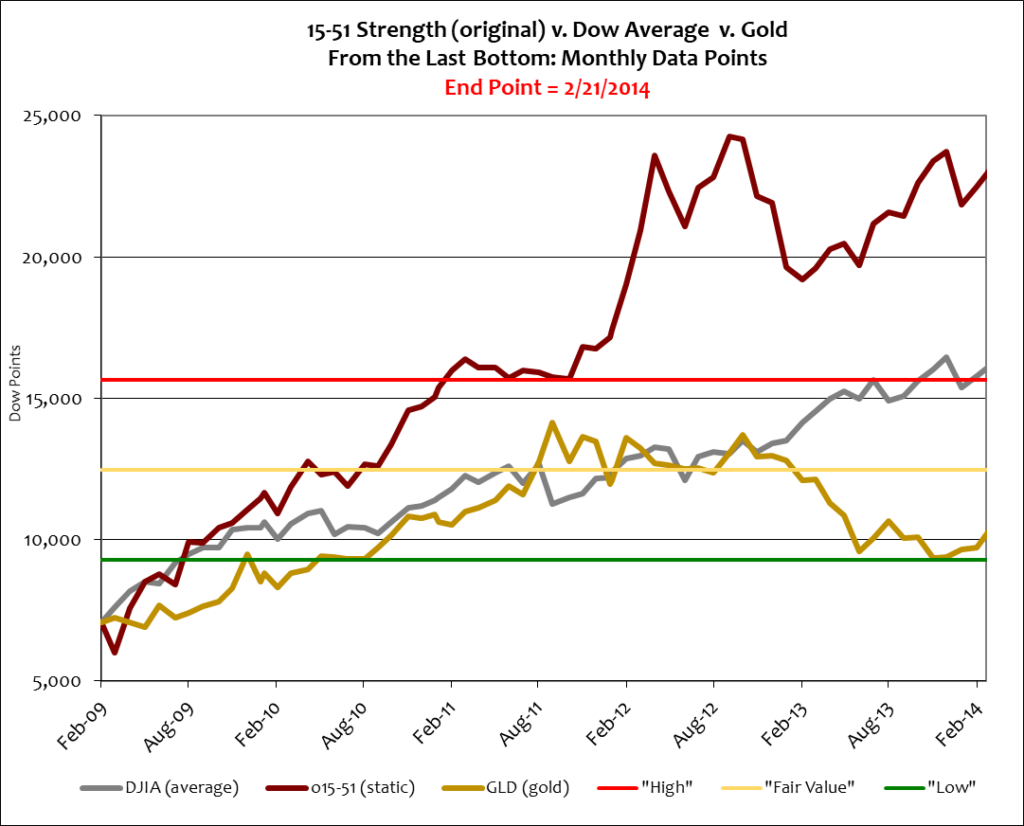
The action zone is a barometer for stock market valuation; according to it stocks remain “high” in value. And even though gold has been securitized the action zone is less helpful when determining its value. However it seems to have found a solid base at $1,260 an ounce (GLD at $122). The action zone can also helpful when determining your stock market allocation.
Under current Market conditions, for example, if your target stock allocation is 50% then that’s what it should be when stocks are at “fair value” (when the Dow is around the midpoint of the action zone.) That allocation should fall to the low end of your range when stocks are “high,” to say 15% of your total portfolio. The time to over-weight in stocks is when stocks are “low,” which is when your stock allocation should increase to say 75%.
This is to say that asset allocations are not, and should not be carved in granite. (It’s impossible to buy low and sell high if they are.)
With that said, and following the theory and logic presented in LYB and these blogs, the 15-51i portfolio should have been rebalanced when the Dow reached sustainable “fair value” after the last correction. Consistent with my modus operandi, the most appropriate time for to rebalance it was at year end 2011, when “fair value” was calculated to be 11,245 Dow points. Here’s a tighter view of the Dow during that time.
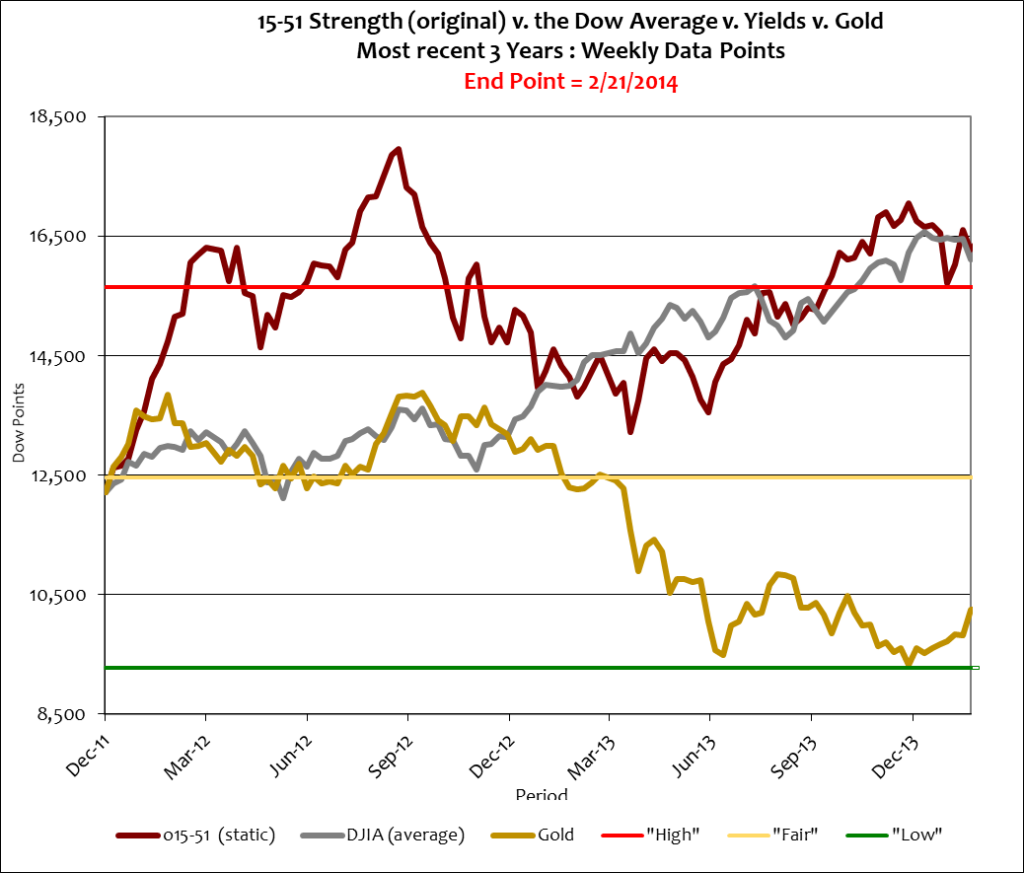
The Dow ended 2011 at 12,218, about 5% above fair value in Real terms. Using that date as the 15-51i’s rebalancing point will once again demonstrate that there is always plenty of time to make portfolio adjustments, and that perfect timing never factors into the formula for success. Besides, clean cutoffs like calendar year ends are completely logical triggers to rebalance.
The 15-51i portfolio ended 2011 almost four times better than the Dow’s value, at 48,517 – that’s the amount to rebalance. And even though the strength indicator will be restructured and rebalanced, the unchanged original 15-51i portfolio will continue to be presented in these blogs, but alongside two sibling-like offspring.
The first is a rebalanced and structurally modified market portfolio committed to indicating stock market strength and above-average sock market returns; that portfolio, a portfolio indicating stock market strength via superior 15-51 design and market diversification, will be signified as 15-51si and/or referred to as Version 2.0 (or V2). Here’s how that portfolio has performed since the end of 2011 compared to the Dow Jones Industrial Average.
As you can see the rebalanced 15-51 portfolio moves in the same manner as “the market” but with superior performance. It’s a much better picture of “market strength.”
That’s the goal and purpose of 15-51 indication – to indicate the movements of stock market strength through superior construction that is consistent with market diversification. Such a portfolio should consistently produce above-market market returns, which it clearly does.
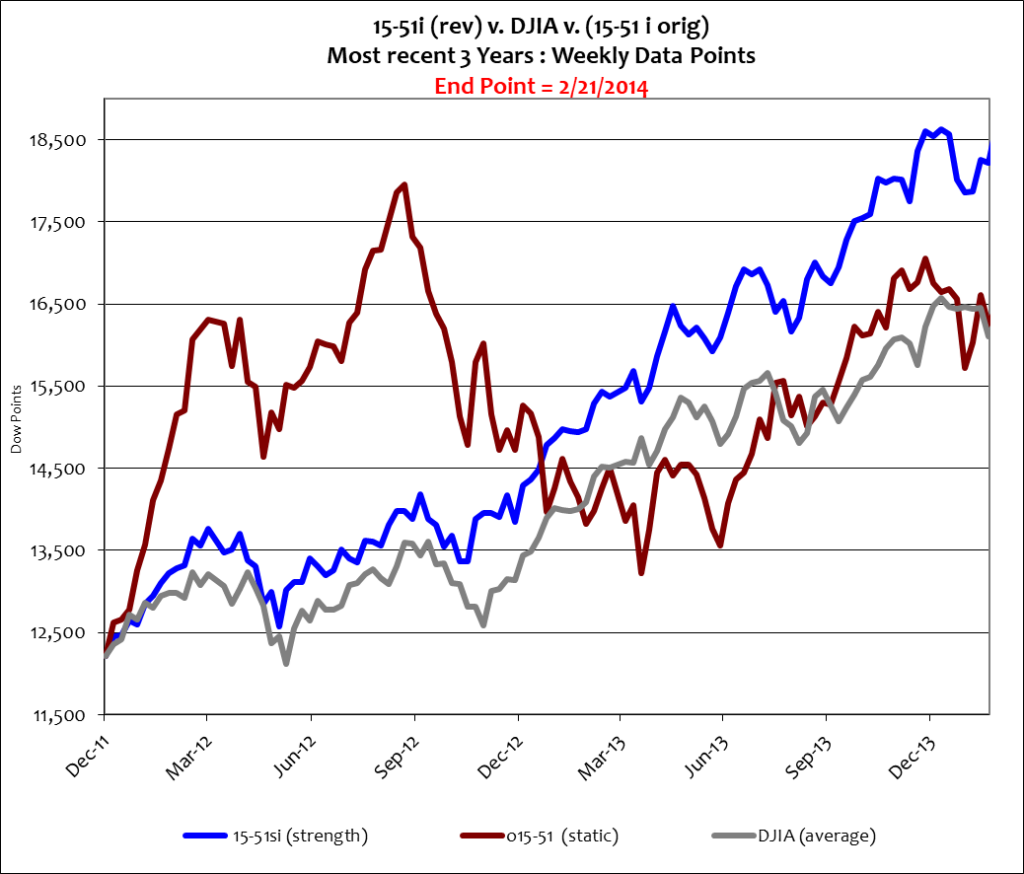
The original 15-51 strength Indicator, which was truly a “market portfolio” when it began in 1996, has begun to move in a way contrary to “the market.” This difference can be seen quite clearly in the chart below that compares activity for the DJIA, the original 15-51 indicator (o15-51i), and the restructured strength indicator (15-51si).
As you can see the original 15-51 strength indicator was clearly due for a change. It became too volatile and moved contrary to “the market” in dramatic fashion.
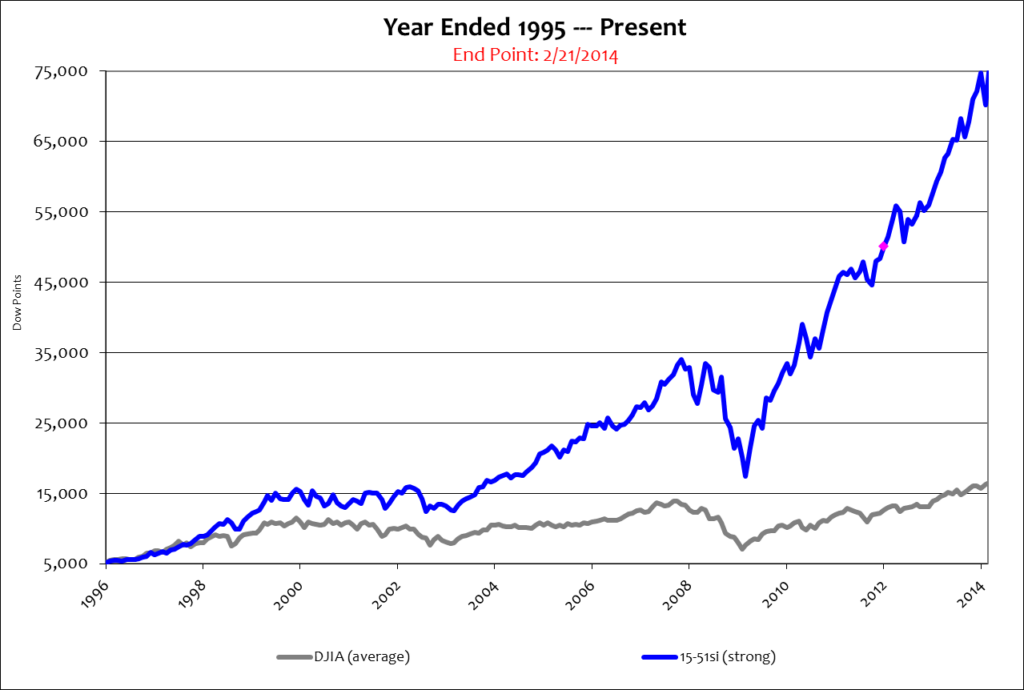
Okay, there’s one more trend-line to show you. Since the rebalancing point of the 15-51 strength indicator is year ended 2011, all activity prior to that will be comprised of the original 15-51 portfolio. This trend-line will thereby show the true trend-line of stock market strength over a longer period of time. Take a look at the chart below that starts at year end 2009.
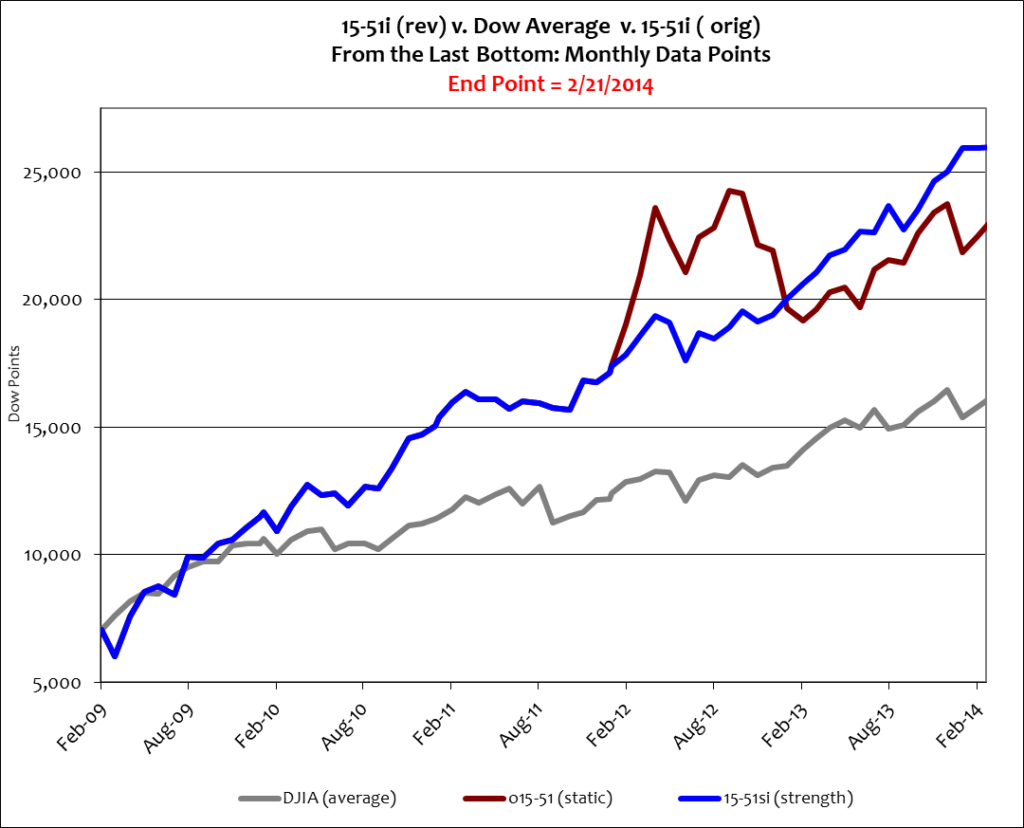
The point at which the blue line and the maroon colored line separate is where rebalancing takes place, which occurred long before the 15-51 portfolio reached its all-time high in September 2012. This provides definitive proof that rebalancing does not have to occur at the optimal time to be extremely effective over time.
The purpose of rebalancing is to minimize volatility, lock in gains, and to ensure stronger future performance.
The DJIA, which was rebalanced and restructured several times during the period shown in the chart, gained just 54% since 2009. The static original 15-51i portfolio added 99%, and the rebalanced V2 portfolio (15-51si) produced an amazing 122% return.
Rebalancing works.
And so does 15-51 construction. It’s better than market construction, which is why 15-51 strength consistently outperforms the average over the long-term.
So going forward from this point stock market strength will be indicated by the bright blue line in charts, signified as 15-51si (“si” stands for strength indicator). The original 15-51 Indicator portfolio, signified as o15-51i (“o” standing for original) will continue to be tracked and presented – but only to illustrate how an unchanged, static 15-51 portfolio performs with complete managerial neglect.
Below is a look at how these portfolios performed over the last three years.
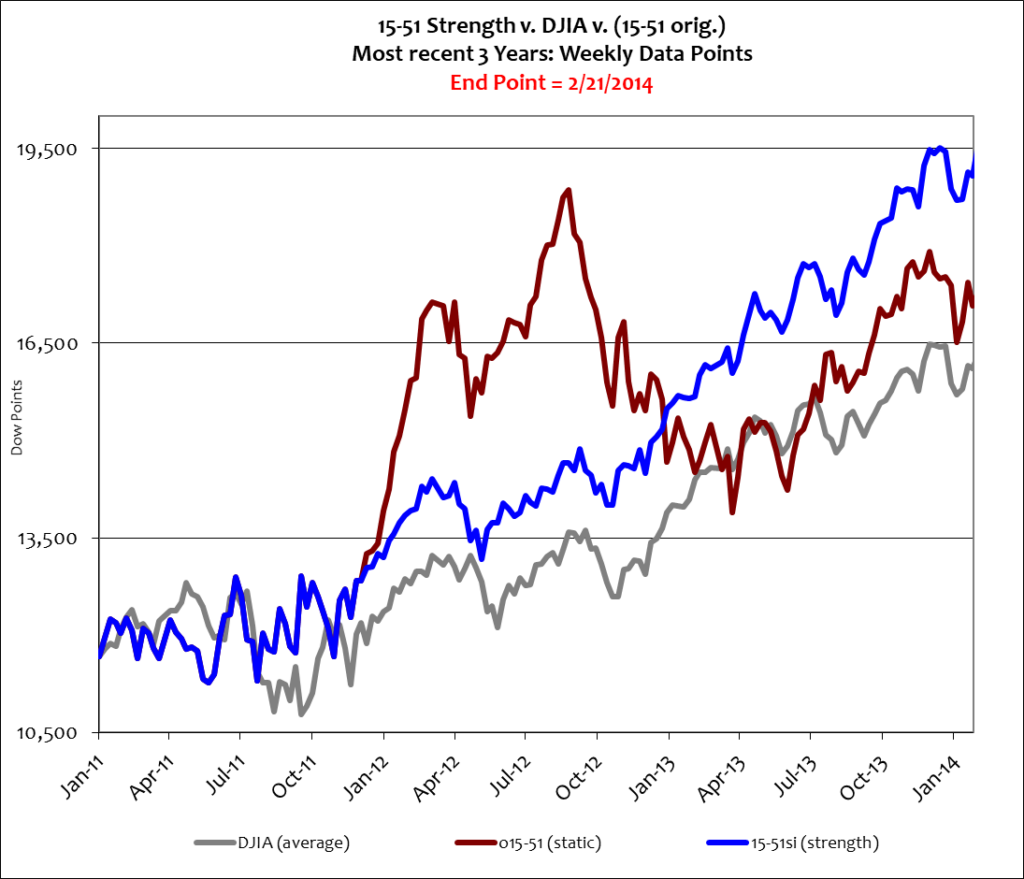
During this time the Dow added 38%, the original 15-51 portfolio returned 46%, and the rebalanced 15-51 strength indicator gained 63%, while closely mimicking the Dow’s trend-line.
That’s how a strong portfolio with market diversification should perform – and it also highlights the most important element of the LYB method and 15-51 construction: when “the market” is high your portfolio is higher. And that makes making money easier.
That’s the Lose Your Broker way.
Until next time, stay tuned…
![]()