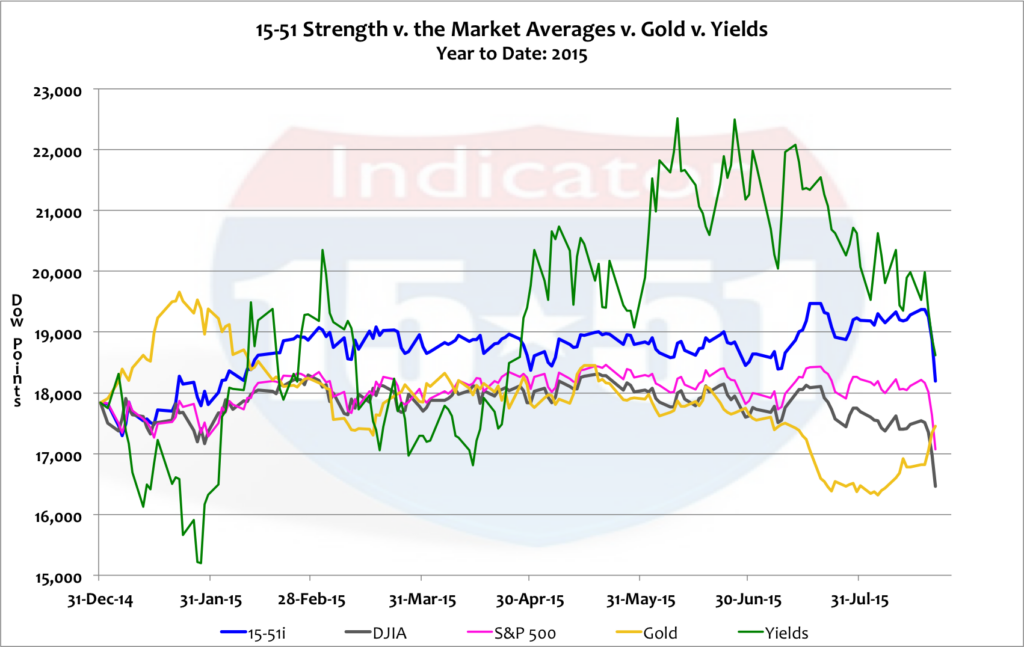
Stocks took a beating last week as all major stock market indexes (the Dow, S&P 500, and 15-51 Indicator) lost 6%. Stock market strength via the 15-51 Indicator is the only index still in positive territory for the year. It’s up 2% year-to-date even after this most recent correction. The Dow and S&P have lost 8% and 2%, respectively, so far this year.
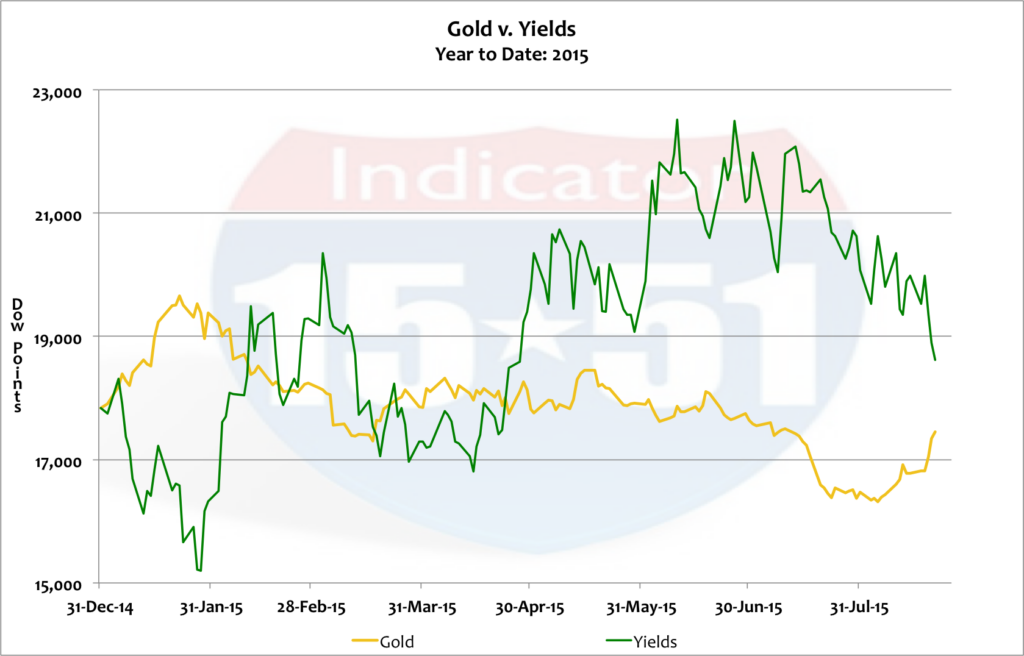
Yields have also fallen by a sizeable amount in the past week, ending 7% lower. And even though gold added 4% in the last five trading days, it’s still down 2% for the year. Below is the ugly chart of year-to-date activity.

The Dow Jones Average hit its all-time high on May 19 of this year (18,312), and since then has dropped 1,853 points, or 10.1%. Some people define a 10% move as a “correction” and a 20% fall as a “Bear Market.” I find these arbitrary definitions not only confusing, but silly.
Corrections are simply a price condition that can happen at any time, in either direction (up or down), for any reason, and in any denomination – 5%, 10%, 20%, or 30%, etc. For instance, the S&P 500 moved 6% this week. That’s a correction – even though the S&P is down only 7.5% from its all-time high (2,131 reached on May 21, 2015). Anyone saying anything different is just being silly.
Bull and Bear Markets are much different than simple price corrections – they are market conditions. Bear Markets are when stock prices lead the market (a.k.a. the economy) downward. Bull Markets are when stock prices lead the economy higher. See the difference? Bear Markets relate downward stock prices to a receding economy, and Bull Markets tie upward prices to an expanding economy.
To better illustrate the difference between corrections and Market conditions we’ll use the run-up to the last major correction to make the point clear. Below is a chart that starts at year-end 2005 (the heat of the housing-boom) and extends to the essential bottom of the last major correction, February 2009. Three critical points are highlighted along the Dow’s trend-line during that time: the market’s top (indicated by a red square), a 13% downward correction from the top (signified by a red diamond), and a further 7% corrective move commencing a Bear Market (signified by a red circle). See below.
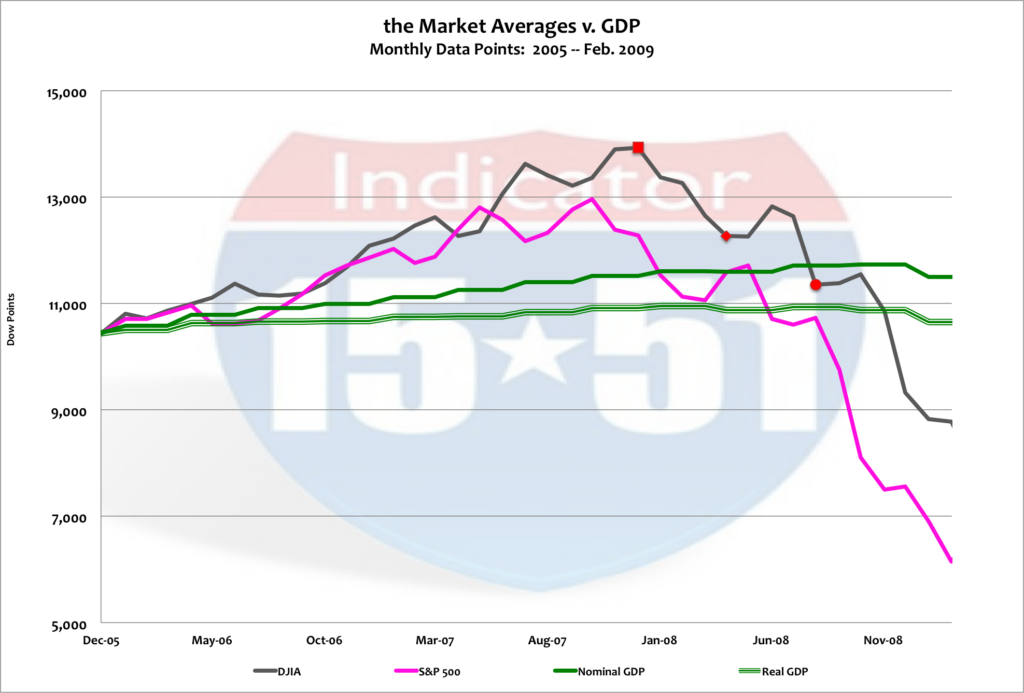
As you can see, the 13% downward move signified by the red diamond is clearly a negative price correction. And though it easily could have been called a Bear Market based on its trajectory (the Dow’s trend looked destined to lead the economy lower) confirmation of the Bear Market didn’t arrive until July 2008 (the red circle). That’s when the Dow crossed under the GDP trend-line. At the commencement of the Bear Market the Dow Average was coincidentally down 20% – but as you can see, prices continued to correct another 23% before reaching bottom. The whole move was a “correction” to the downside. It began in October 2007 and didn’t end until February 2009.
A Bear Market lasts for as long as the stock market averages underperform economic output as measured by the long-term GDP trend-line. In other words, the Bear Market doesn’t end until stocks start to consistently lead the economy higher (a.k.a. a Bull Market). This transition, from one type of market to another, is never an even process. In fact, the stock market was littered with up and down corrections from the time the Bear Market arrived (July 2008) until it finally ended (around June 2013). See below.

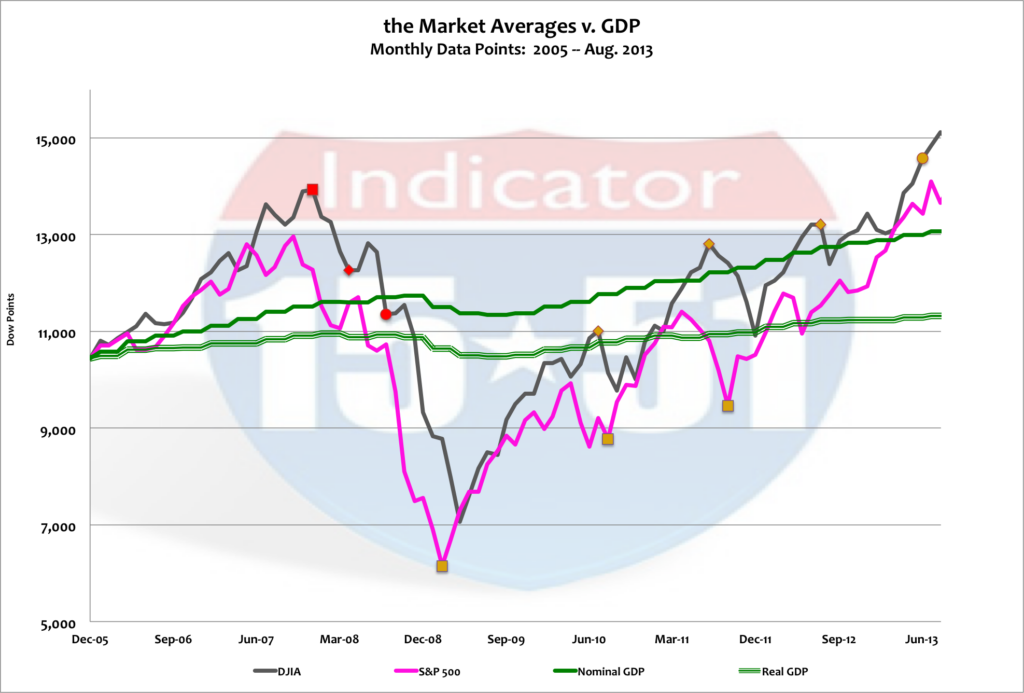
Downward corrections do not always make Bear Markets just as upward corrections do not always make Bull Markets. For instance, it would be foolish to ascertain that the market move from March 2009 (the market bottom) to July 2010 (the first yellow diamond after the market bottom) was a Bull Market simply because stocks advanced from 6,148 to 10,772. At that point stocks were still 4,000 points off their high and well below the long-term trend-line of Nominal GDP. (The DJIA is a nominal trend-line.)
The yellow circle all the way to the right of the chart above is where the new Bull Market commenced (June 2013) – which is the point at which stocks began to consistently lead the economy (GDP) higher.
So why do I go through such great pains to make this point clear?
Because it is important to understand what happened last week. It was a simple price correction – and a minor one at that. Sure, six percent is a big move for a five-day trading week. No doubt about it. But it’s important to keep it in perspective. Last week’s 6% move was a minute event in the grand scheme of things. In fact, the Dow’s 10% correction is just as miniscule, a proverbial blip on the radar screen.
Consider that “the market” is still valued higher than the peaks of the tech and housing booms in Real terms – and the modern economy is nowhere as robust as they were. (This is explained more thoroughly in my new piece, SURVIVING THE NEXT CRASH, which can be downloaded for free on my homepage.) And, ironically, the Dow is currently trading at the same exact multiple as it traded to Nominal GDP in October 2007, just before the last major corrective cycle began. (How’s that for an eerie coincidence?)
The chart below drives this point home by bringing the above trend-line up to date. It’s a 10-year look from year-end 2005 to present day, August 21, 2015. This timeframe puts last week’s move into proper context. See below.

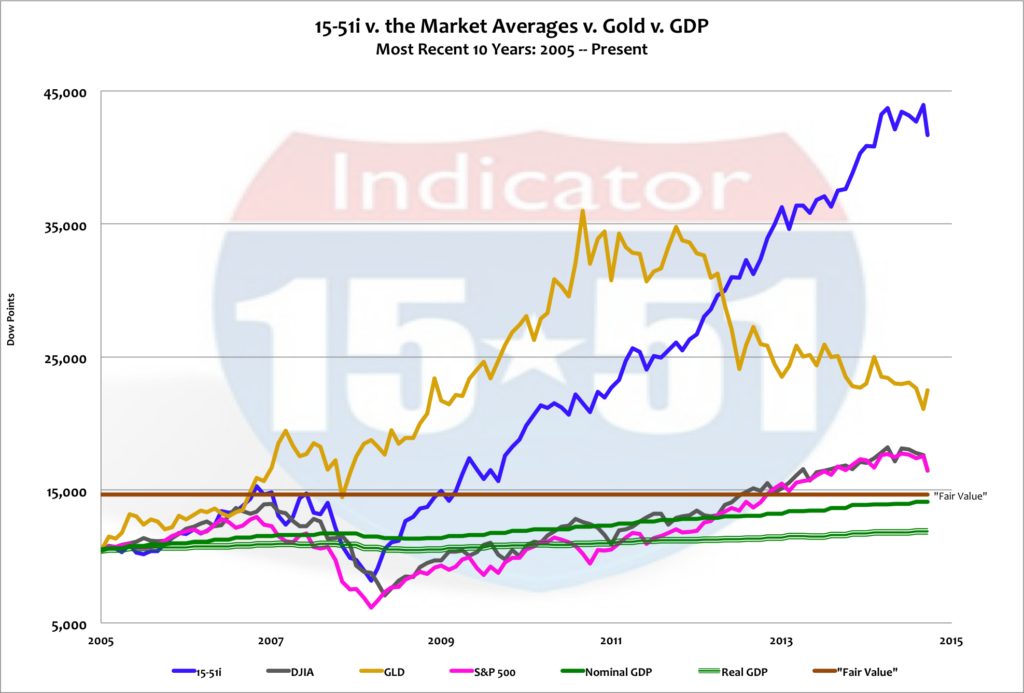
Last week’s 6% drop looks like no big deal in the chart above – and that’s an accurate assessment. And while last week’s move was an insignificant amount in the big picture, it was still a major warning signal. A move of that size in such a short amount of time is the equivalent to a quick, sharp chest pain. It should seize attention.
And the reason it should capture attention is because stocks should really be trading close to “fair value” – that’s 2,000 points from where the Dow stands today after the 6% correction – which would represent a 20% correction from its recent top. But that 20% move would not automatically present a Bear Market because stocks would be trading at fair value and above Nominal GDP’s long-term trend-line.
To be sure, however, a 20% correction can certainly indicate that a Bear Market is on the way. Recall the major issues facing the global economy. Growth has been consistently weak and uneven at all corners: China is in a shambles. Europe is a disaster. The Middle East is at constant war. Emerging markets are at high risk. And the fragile U.S. economy is producing frail growth and statistics that have been inflated by trillions of dollars of newly printed money via QE that has produced an abysmal ROI and amassed the largest amount of national debt ever recorded in world history.
That said, it is totally reasonable to expect stocks to continue downward and for a Bear Market to ensue. In fact, current market indicators and dynamics are acknowledging this threat.
Take oil, for instance. It is down below $40 per barrel for the first time since the heat of the Great Recession. The drop in oil is reflective of lower global demand and the unwillingness of producers to curb supply. Let us also not forget that terror organization ISIS uses oil proceeds to fund their war effort, as does global antagonist, Russia. These threats provide extra incentive to keep oil wells pumping and prices low. Add to this the specter of Iranian oil supplies flowing into world markets that were freed by the new nuclear agreement – and $30 per barrel seems almost impossible not to materialize.
Lower oil prices are a double-edged sword. While the economy likes the revenue savings to spread around other market sectors, and therefore provide economic benefit, the current dynamic is different. In this instance, lower oil prices indicate soft demand and economic weakness. In other words, consumers aren’t spreading savings from energy products to other sectors of the economy. This is corroborated by what’s happening in China.
China’s manufacturing base is shrinking and growth is slowing substantially, and in a surprise move last week, they abruptly devalued their currency in hopes to reverse their downward spiral. In other words, China made this move because internal economics are going south and global demand is weak. A devaluation of their currency, in theory, would make Chinese products cheaper and thus increase demand and growth.
But there’s a problem with that thinking. First, most world governments are also devaluing their currencies at the same time. This minimizes the potency of the Chinese move. And second, many Chinese suppliers are raising their prices in the face of their government’s currency devaluation, which also produces headwinds to the Chinese currency move.
Again, currency games like this and QE cannot fix Market problems.
Perhaps that is the reason global stock markets are selling off and U.S. bond yields have dropped so dramatically. Remember, yields decrease when bond demand increases. The recent drop in yields (along with lower stocks prices) indicates a skittish investor populous migrating from risk to safety. Gold’s recent reversal corroborates that dynamic. See below.

The first market rattle of the last major correction occurred in February of 2007 – eight months before the market topped, and eighteen months before the correction began its severe decline.
Major market corrections like that take time to metastasize, which luckily gives investors plenty of time to act before it’s too late – that is, if investors are listening to what the markets are saying.
Last week was just the beginning – and the worst is yet to come.
Spread the word, and stay tuned…
![]()