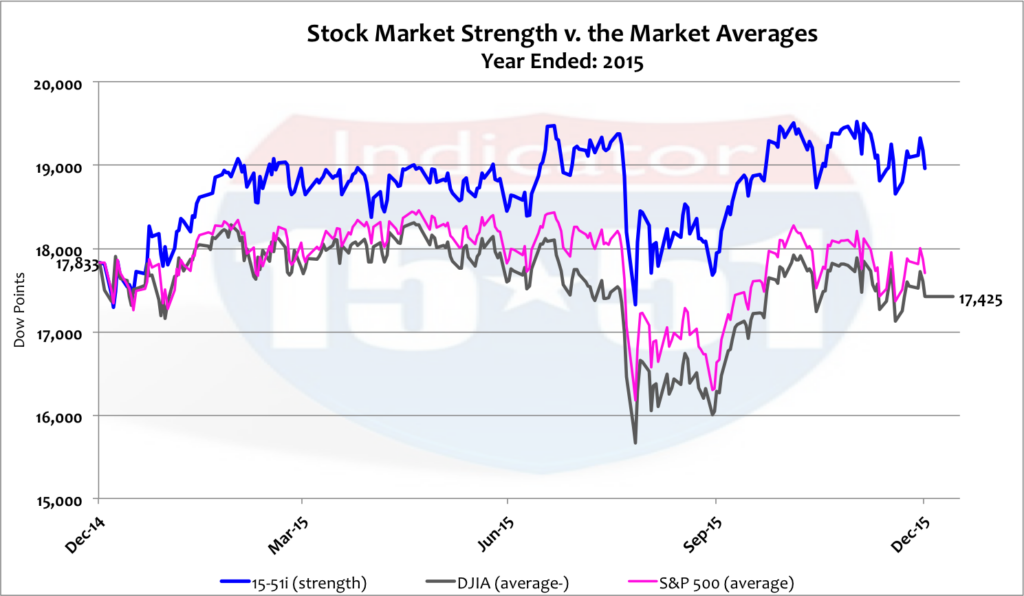
Stock market strength was humming along when December began; the 15-51 Indicator was up 9.5% for the year and at an all-time high (113,993). But then Janet Yellen raised interest rates and Santa Claus failed to deliver a rally. Though the 15-51 Indicator posted a respectable year-end gain (+6.3%), the other major market indexes ended in a whimper. The Dow Jones Industrial Average ended down -2.3% for the year and the S&P 500 lost a fraction (-.7%). See below.

While the 15-51 indicator performed well overall, performance by industry was all over the map. Of the seven total industries, four posted gains and three posted losses. The best performing industry was Technology (+22%) and the worst was Energy (-14%) –which stands to reason, as oil and gas prices are down some 50% in the past year or so.
But you don’t hear the clamoring to tax the hell out of energy companies now, do you?
According to some it’s okay for oil companies to earn substantially less money during these times but it’s not okay for them to make it up when things turn around. This mindset fails to appreciate the extensive amount of investment energy companies have to make and how risky those investments actually are.
It’s amazing how so many people fail to grasp how long it takes to procure oil, refine into a hundred different blends, and then distribute it throughout the entire country — all the while navigating the most regulated operating environment in the global marketplace. They think it’s easy, and that it happens overnight — which is so not the case. It is the painfully long lead-time to profit that makes oil companies so vulnerable to major price/cost fluctuations, both up and down, despite their sophisticated hedging strategies and tactics. And that’s what got them this year.
The performance for the other five industries shook out as such: Consumers Staples (+17%), Financials (+11%), Consumer Services (+9%), Industrials (-7%), and Basic (-8%).
Technology stocks in the 15-51 Indicator can be broken down into two classes: Personal (ie: Google) and Industrial (ie: Cummins). These two classes couldn’t have performed more differently in the year. Personal technology gained 38% in 2015 while Industrial technology lost -14%. Remember, the total industry grew at 22% f0r the year. Take a look at the dichotomy illustrated below.

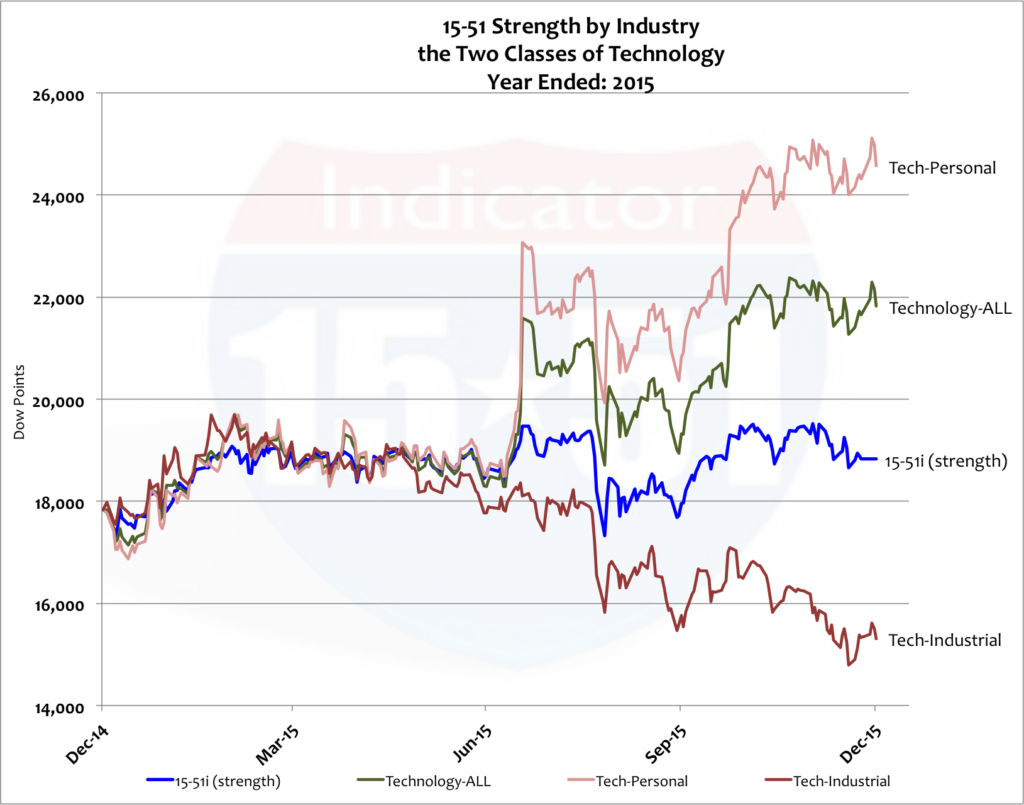
The performance in this industry is a case in point for diversification. It proves that with solid construction you don’t have to be perfect with stock selection to still produce well above-average returns.
The dog in the above allocation was Cummins, which was down a significant 38% for the year. But I’m not worried about Cummins as a worthwhile investment — even in the face of a wave of downgrades from major brokerage houses. Cummins is a solid company operating in a shoddy economy. Business investment was down significantly in 2015, and that’s a significant portion of Cummins’ business.
Other 15-51 sectors to note for 2015 are: Healthcare up 17%, Retail added 8%, Consumer lending gained 19%, Automobiles advanced 8%, Apparel gained 30%, and Capital equipment lost -13%.
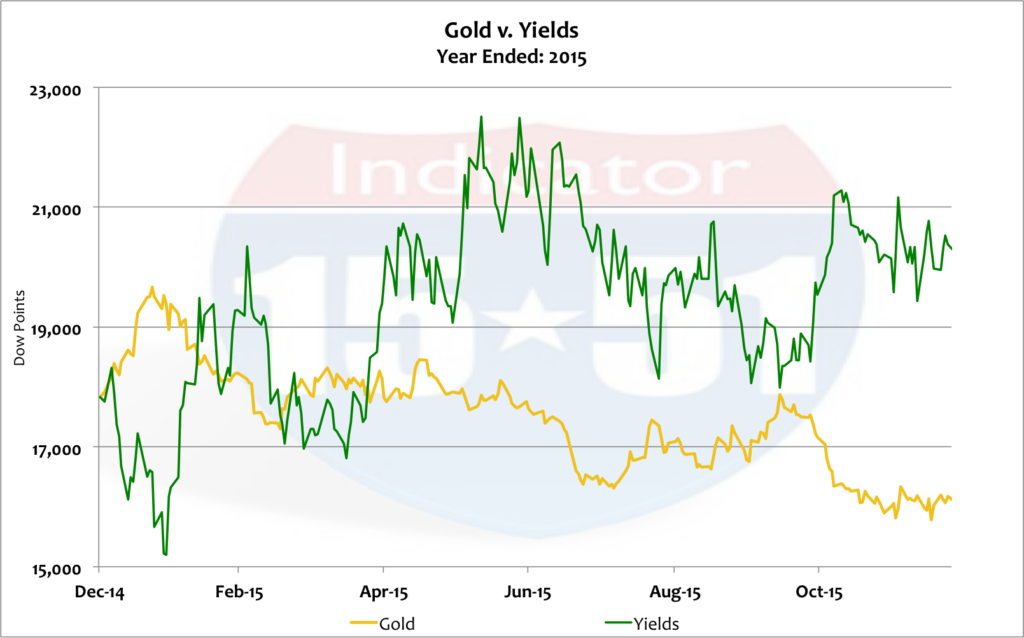
And if stocks ended the year in a whimper — gold and bonds ended in a full blown bawling. Gold was down again this year (-11%) and yields increased by 15%. Bonds move in the opposite direction as yields. See below.

The coming year is a big one: the U.S. central bank is tightening money and raising interest rates while the rest of the world is doing the opposite; the fragile global economy continues to soften even though energy prices are at ten year lows; most of the world is at war; and America is gearing up for another hotly contested presidential election where the constituents are more angry at the ruling class than ever before in my lifetime.
Significant change is in the air.
As stated in SURVIVING THE NEXT CRASH, I would be shocked if a major correction didn’t ensue in 2016 or just as Obama leaves office. When that happens, the trends shown below will reverse.

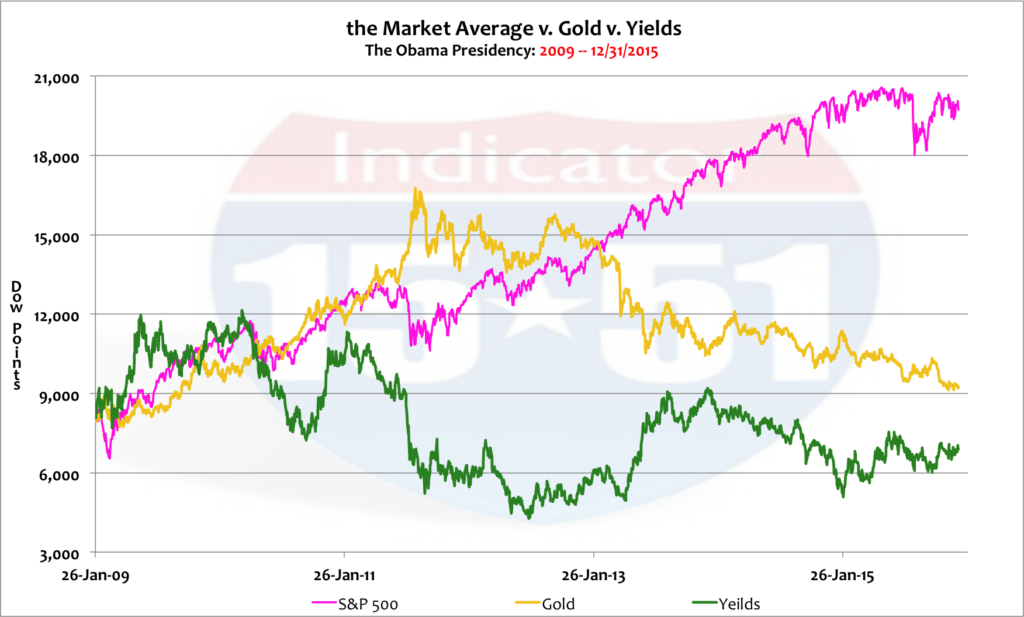
Gold corrected to the downside shortly after the economy recovered from recession, when at the same time stocks made a bold move to the upside — bolder than both logic and reason would rightfully dictate. (But hey, that’s what corrections are made of.) Gold and stock values will again crisscross when correction takes flight (stocks down and gold up).
Yields remain at historic lows. The 10 Year T-Note is still only 2.25% and it hasn’t moved since the Fed finally raised rates a couple of weeks ago. If the economy was as strong as the mainstream wants us to believe the 10 Year would have been around 6% for years now. But no, it’s still in the basement.
In fact, yields won’t be able to get that high (6%) under positive economic condition this time around. The world can’t handle it. Instead, yields must wait until the aftermath of the next hell — when a global devaluation of money and debt brings about the mother of all corrections. It will be that adjustment that will force yields to levels not seen since the 70’s and 80’s. Fed action will be impotent.
And for those investors thinking that the stock market isn’t that overvalued — maybe a little bit, but not that much — beware! Remember how easy it is to manipulate the market indexes and how much free capital was given to the Wall Street establishment to do just that. Obama’s boom — the QE boom — has been used to inflate the stock market balloon so much further than ever before that the next bust has no choice but to be the worst one in history.
Whatever causes a boom suffers the most during the according correction, like technology did during the Internet boom and housing did during the subprime financial crisis.
The QE boom is a money and debt boom, so they will suffer the most during the next correction. And the stock market will again go for the ride — this time downhill.
Those who have read my book know the 15-51 Indicator portfolio as well as I do. They know it is a good portfolio, not a great one. Its purpose, simply, is to indicate the performance of stock market strength, which it reliably does. That’s it.
But the 15-51 Indicator has another key benefit. Because the establishment or mass media does not cover it, the 15-51 Indicator is free from a majority of Wall Street’s manipulative efforts. In other words, they don’t care what the 15-51 Indicator is doing so they don’t purposely manipulate its trajectory. As a result, it provides the best gauge of stock market inflation actually present in the marketplace. See below.

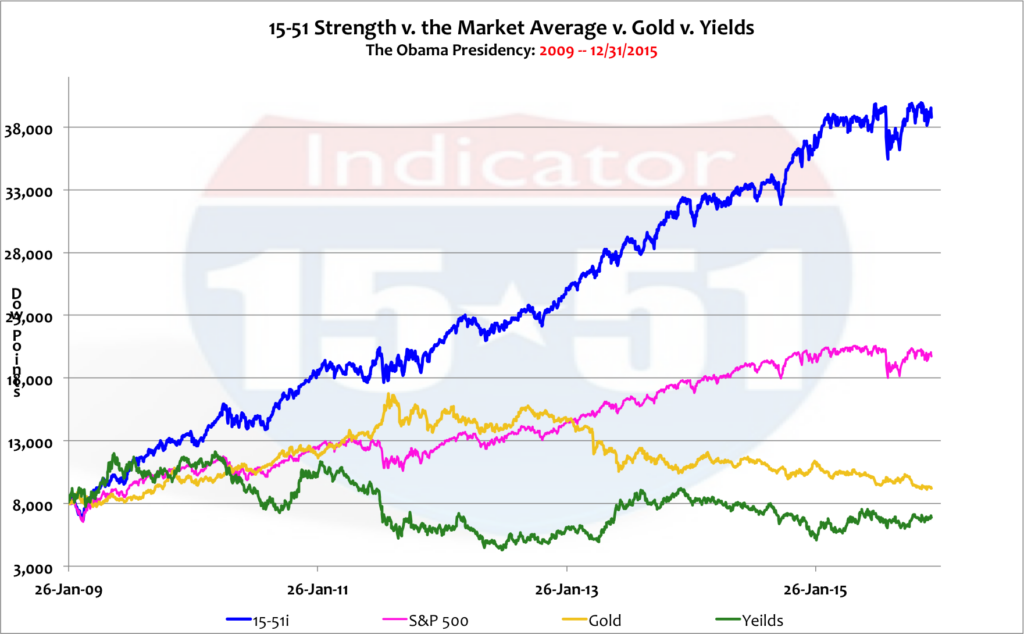
The 15-51 Indicator has gained 380% during the Obama presidency, an average of 55% per year — when economic growth has never risen to boom-like levels. In fact, GDP growth has been half the rate of the last two economic expansions. In other words, economic growth didn’t push stock values up so high, inflation did.
And you can thank QE and President Obama for that, and what comes next.
Stay tuned…
![]()