There is little doubt that the recent drop in fuel prices has significantly affected economic activity to the upside. Gas prices around my market have dropped more than a dollar per gallon. That gives consumers an extra $100 to $200 per month to distribute to other sectors of the market economy – and with the holiday season upon us, it couldn’t have come at a better time.
The world needs a strong fourth quarter. Lower oil prices will surely help that cause, but for how long?
When oil prices fall OPEC usually cuts Supply (production of crude oil) to force prices higher, or to hold oil at its current price. OPEC, a cartel of oil-rich countries, control world prices through their ability to greatly affect the world Supply of oil.
A decrease in Supply generally causes prices to rise, as long as Demand holds steady. If both Supply and Demand fall together prices hold steady.
By standing pat with their current production plan, OPEC has indicated that they, too, are concerned about weakening global demand. They believe higher oil prices will cause more trouble than they’re worth. And who could blame them.
The world economy is screeching to a halt – China, India, Europe, and Japan continue to show major signs of weakness. Growth is slowing and inflation is dropping (a sign of weakening consumer demand.)
Companies produce less goods when demand is falling; therefore, less energy is used in the production of goods. And with less production, fewer goods are transported to markets; and again, less fuel is required to move fewer goods and raw materials. It’s a vicious cycle that can lead to recessionary deflation – and OPEC knows it.
Deflation, the general decrease in prices, is a condition that occurs when consumer demand falls faster than the level of Supply (the amount of goods produced and distributed to markets.) In other words, excess Supply causes prices to drop.
Oil prices affect the entire economy, and dollars spent towards it drain money from the rest of the economy. Lower oil prices help the entire economy because more money is available to spend in other sectors of the economy. Higher oil prices steal that money away and can easily push a weak economy into recession – which is a breeding ground for deflation – and OPEC knows it.
OPEC’s decision was this: Sell less oil for more money per barrel, or sell more oil for fewer dollars per barrel. They recently chose the latter.
Besides, OPEC also knows that lower oil prices will pressure American shale oil drillers, who need higher oil prices to cover their higher costs of production.
This is not to mention the ISIS terror threat, which has high-jacked oil fields in Syria, Iraq, and northern Africa. Falling oil prices strain their war effort.
And OPEC knows that too.
So it appears that low energy prices might be here for a little while. That it should help corporate profits in the fourth quarter, like it did in the third. Real GDP for the third quarter was recently adjusted upward to 4.6%, from 3.9% — thanks to falling oil prices.
America uses about 7 billion barrels of oil per year. That amounts to $462 billion per year at current pricing – a mere 3% of the economy, and a smaller fraction of the national debt. Yet a drop in its price triggers an automatic market impact similar to the positives experienced with a tax cut.
In other words, falling oil prices have done more good to the U.S. economy than the trillions of dollars the U.S. government has spent over the last several years. And that’s sad.
It’s even sadder that the answer to economic woes is never about people and markets. Instead it’s about printing more money and handing it to banks that turn the lion’s share over to corrupt central governments who blow most of it and waste the rest. That’s good for politicians, not people.
Market freedom and People everywhere lose when government policy is dedicated to devaluing currency and expanding government debt and deficit. Their gain comes at the expense of free market participants. That’s good for government, not markets.
Governments get away with their money laundering scheme by portraying their QE efforts as required to save the world from apocalypse. And it’s total BS.
Case in point: falling oil prices help boost the majority of the market economy; and the only things QE-type policies have done is expand government, enrich Wall Street banks and bankers, and inflated the stock market to ungodly valuations.
This incubates a bigger problem, as a booming U.S. stock market makes everything look rosy to other central bankers and governors, and so the world follows along.
A struggling Chinese Market has recently undergone an easy money effort of their own, and Japan’s Shinzo Abe is asking his people for more time to let his easy money policies prove themselves. And while those two markets are on the road that America paved, there is a riff brewing inside the European Central Bank (ECB) over their form of quantitative easing (QE): their chairman wants it, but an executive board member doesn’t. One thinks it will cure the deflationary threat; the other doesn’t think the costs would be worth the benefit.
The latter has it right. Easy money policies don’t solve anything; they just delay the inevitable – which is made worse by the massive increase to the monetary base. That’s what will make the next correction so terrible.
Think of it this way, the Federal Reserve has printed more than $5 trillion dollars of new money in America over the last several years. That’s $15,823 per American person. But is money any easier to come by?
Of course not. If anything else, money is harder to come by.
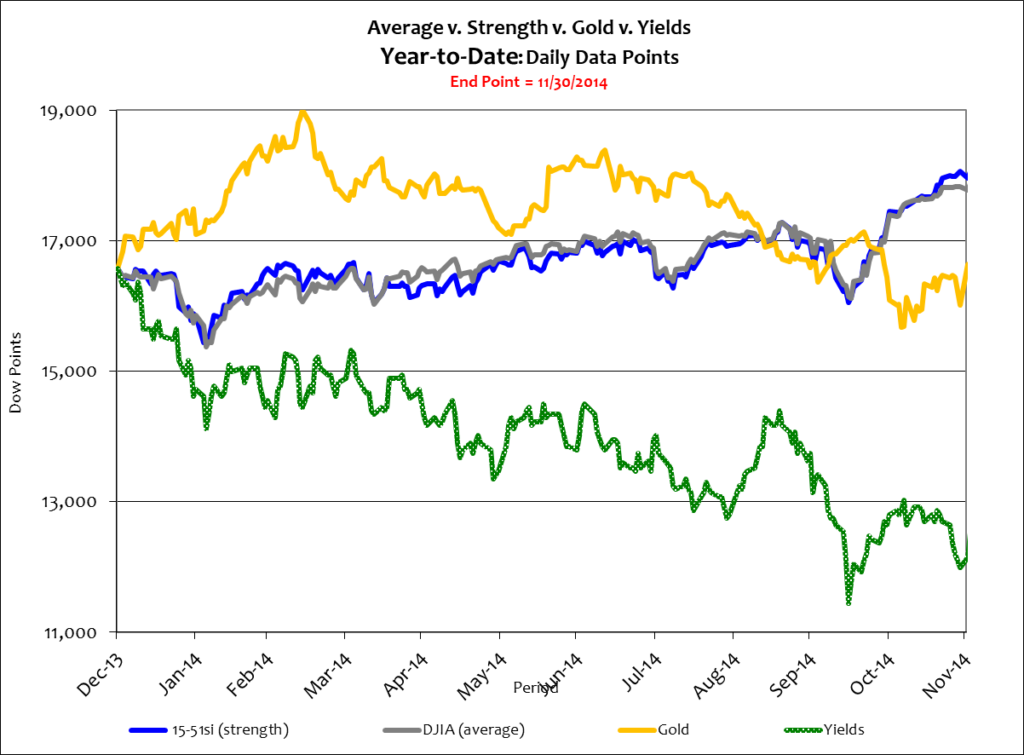
But you wouldn’t know that by looking at the stock market. The Dow Average is up 7.6% through eleven months and 15-51 Strength has added 9%. Gold, as one would expect with an up stock market, is down 3.5%. The year-to-date chart is below.

Records abound in the stock market, as Strength is starting to peel away from the Average. And talk about finicky; stocks are up 13% after their 7% sell-off in October, just one month ago. Gold has done a complete reversal since spiking earlier in the year, appearing as if investors were expecting a recession but changed their minds at mid-year.
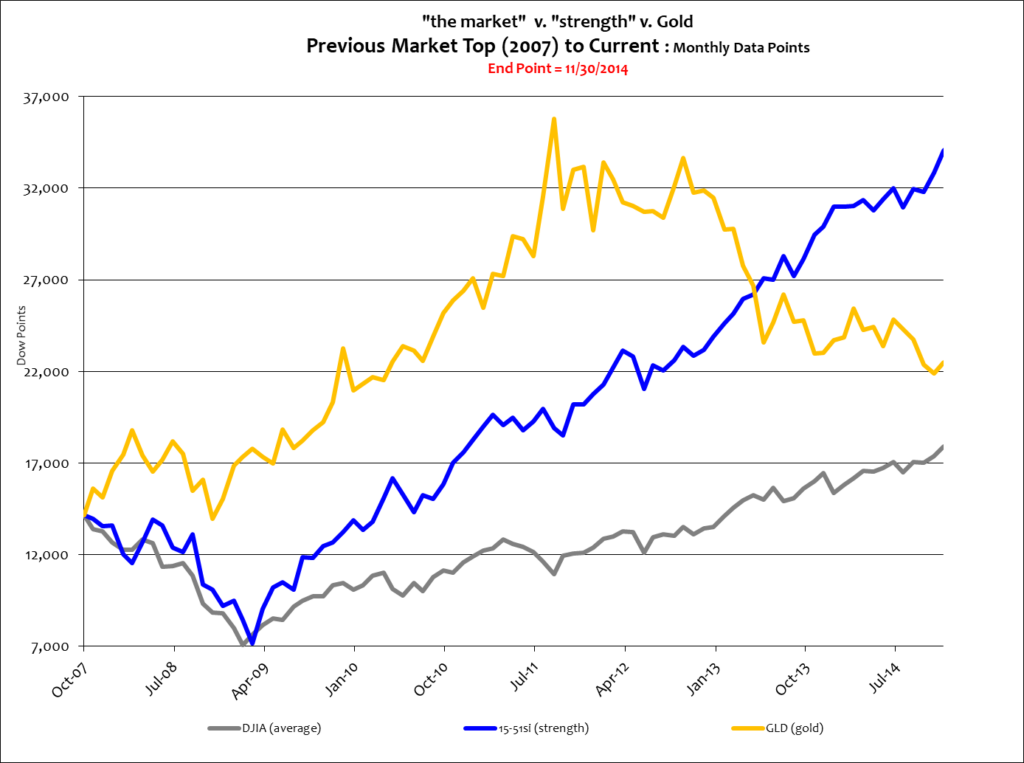
It’s even easier to appreciate the stock market Bull Run in longer term views. Below is a seven year look.

It is clear that gold corrected after the stock market recovered, and continued building lower highs as stocks took off. Since the prior market top Strength is up 140% while the market Average has added just 26%. Gold is up 55%.
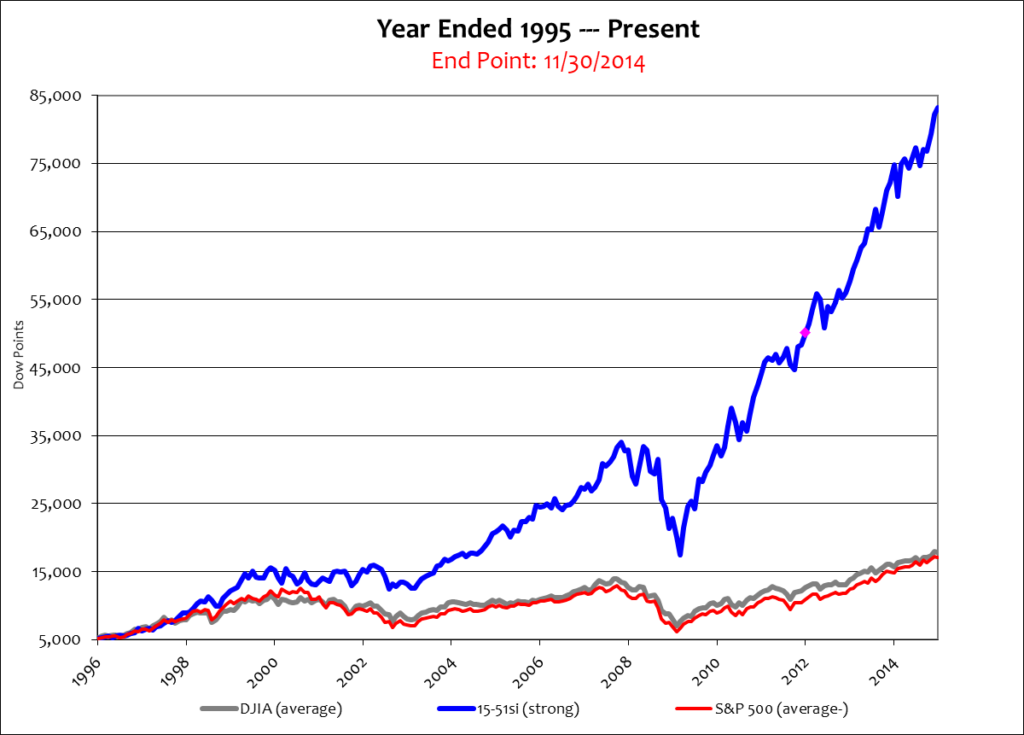
And since we’re talking about new all-time high records, the 15-51 strength indicator has also recently achieved a new milestone – 82,172. The chart below shows its entire history from inception: 1996 through November 2014. Remember, both the Dow Average and 15-51 Strength portfolios started the period at 5,117.

In almost 19 years of activity 15-51 Strength has produced a stunning 1,506% return on investment – that’s 80% per year, and 606% better than the Dow Average, which posted a 249% gain, or 13% per year. It’s been a brazen run for Strength.
Think about the performance this way: the Dow is currently at 17,828, a record for it. The last time the 15-51 Strength portfolio was at that value was August 2004 – 10 years ago! – and more than four years before the ’08 crash.
Strength, speed, and performance.

