Success is a constant pursuit, not a moment in time – especially when it comes to investment.
Those looking for overnight success are gamblers, who must rely on luck to win. And that is the riskiest approach to take with investment.
The least risky tactic, therefore, is one that seeks success over a long period of time that relies on something more easily had than a blessing from the heavens – like logic, math, historical fact, or better yet a combination of all three.
Let there be no doubt, a long-term perspective is the safest method with the highest probability of success because the extended view affords the investor more margin of error and plenty of opportunity to adjust course should things go awry. That kind of wiggle room provides some much needed comfort for what many individuals perceive as a very scary world of investment.
Comfort is an often-overlooked element to success. Let’s face it, no one wants their heart surgeon to be wearing tight shoes in the operating room. It’s hard to be successful without comfort, and with investment a long-term view helps provide it.
It is also comforting to know that even a little luck isn’t required to be successful with investing. In fact, most investors who consistently fall short of their objectives do so for two basic reasons: either they don’t employ a winning strategy, or they fail somewhere in the planning process.
And what better time than a New Year for a blog focused on planning, establishing objectives, and implementing strategies and tactics to bring about success?
That is today’s feature.
All plans have one mission: to achieve the objective. The first step towards that end is to define the desired outcome. Goals should be reasonable, clear and concise.
Next the plan must include strategies and tactics that support the mission. Once employed those strategies and tactics need to be tracked, measured, and evaluated. Performance compared to your benchmark or target is the report card for your plan. Only after its review is it possible for an investor to have everything required to act should the need arise.
Let’s use my portfolio for example. The mission for the 15-51 Indicator™ is to indicate how stock market strength is performing. The Dow Jones Industrial Average and the S&P 500 aim to indicate average stock market performance.
In order to succeed in its mission the 15-51 Indicator™ (15-51i) must achieve two specific objectives: 1) it must consistently produce above-average stock market returns (thus indicating a “strong” performance); and 2) it must move in a “market-like” way (thus proving market-diversification.)
The Dow Jones Industrial Average (often referred to as “the market” and signified as DJIA) and S&P 500 are portfolios designed and constructed to produce average stock market returns. They, and to me the Dow specifically, define what “average” and “market-like movements” actually are.
My mission is clear and exact: consistently outperform the DJIA while closely resembling its movement pattern in all markets, up or down.
In order to succeed I employ four main strategies and tactics. First, I begin by utilizing a superior allocation model, my 15-51™ system, and then follow that by selecting a higher percentage of higher quality stocks than the DJIA does. This is easy, of course, as the Dow is stacked with mediocre performers (which is one of the strategies they employ to achieve “average” returns.) The superiority of my tactics automatically makes my portfolio stronger than the Dow Average.—And that is the reason my portfolio consistently outperforms it.
The two strategies mentioned above support the performance angle of my mission. The next two strategies are employed to produce the market-like movement pattern I aim for. To do this I start by accessing similar market segments in similar proportion as the Dow Jones Average does – again using 15-51™ design – and then follow that by connecting directly to “the market” by including some Dow components in my portfolio (just a few of the good stocks).
The strategies and tactics I employ, based simply on logic and mathematics, stack the odds of success in my favor. That too is comforting. But there can be no set-it-and-forget-it mentality with investment. Monitoring performance is key. A watched pot never overboils.
Year-ends close the marking period and serve as a report card for every plan. And while one year cannot make success in a long-term venture, one year also cannot make failure. Missing a short-term target in a long-term project is not a catastrophe but a trigger to do something – review, evaluate, and possibly adjust.
In 2019 the Dow Jones Industrial Average (my target) posted an unbelievably strong 22% gain. An impressive performance for what the world calls Average. The 15-51 Strength Indicator succeeded in its mission again last year by recording an above-average 26% return on investment. —But neither of those portfolios are the real story in ‘19. The S&P 500 bettered both portfolios with a stunning 29% gain. See below.
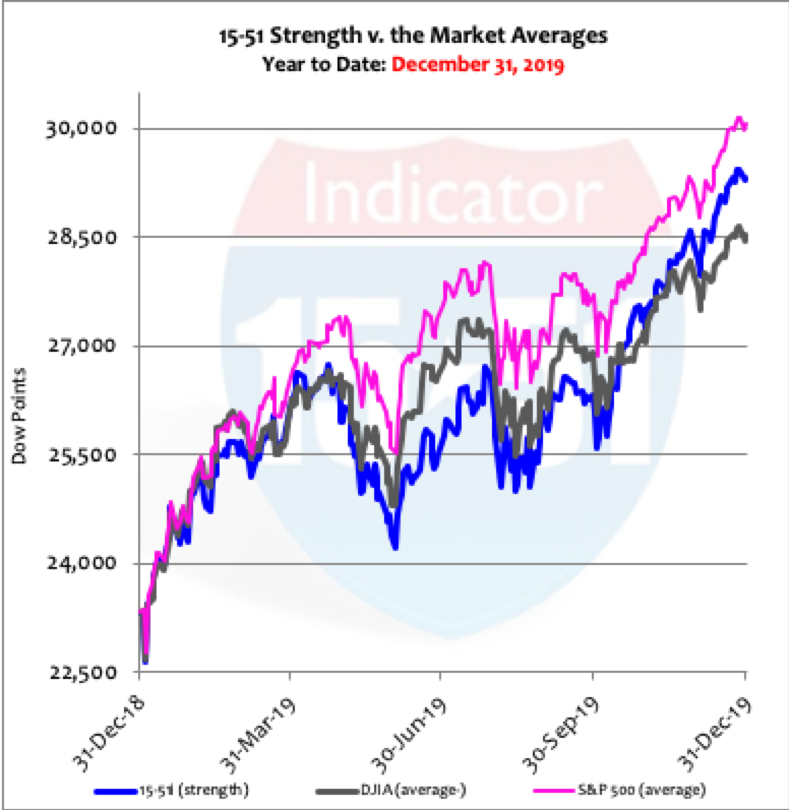
Even though all three portfolios moved with the same rhythm during the year it can never be called a normal occurrence when a 500-stock portfolio outperforms two the sizes of 15 and 30. That indicates stock market inflation is very broad, or very inflated, which is also referred to as hyperinflation.
Note: If “the market” is highly inflated then so are my portfolio and yours. Investors that make this connection are less likely to be surprised when steep downward corrections materialize.
Understanding the environment for which your portfolio operates is also an incredibly important element to being comfortable with investing. No doubt, it’s easy to get distracted. The 2020 election is in full swing, the U.S. and Iran are trading missiles in Iraq and Syria, the trade deal with China is still lingering, North Korea is still a pest, Brexit uncertainty persists, and the rest of Europe remains in disarray.
Surrounding that mess of news stories are reports of how grand the U.S. economy purportedly is with its raging stock market used as proof positive. Indeed, the world is being dragged along by the mighty U.S. – but economic growth isn’t that strong. American GDP has averaged just 2.3% annual growth this year with damn-near full employment. Growth should better than that – especially when considering the central government continues to spend 4 Trillion with a ‘T’ dollars every single year.
Yes, the Trump economy is better than Obama’s – but only fractionally, averaging 2.5% growth thus far in his term compared to 2.1% post-recovery growth under Obama. That’s because the Trump tax cuts were too small and added little benefit, and his regulatory rollbacks have been slow to produce only modest gains. Things are better now for sure, though marginally. And remember, the tech-boom economy grew at twice the rate of this economy while producing the same kind of stock market returns.
That’s what makes this stock market so pricey. It’s called hyperinflation (see also: Action Point Approaching).
In fact, the 15-51 Indicator™ has averaged a strong 23% gain every year since the Trump stock market began 3 years ago – that is to say a rapid rise in prices over an extended period of time. The Dow averaged 19% per year and the S&P returned 17.5% per annum during the same three-year period. See below
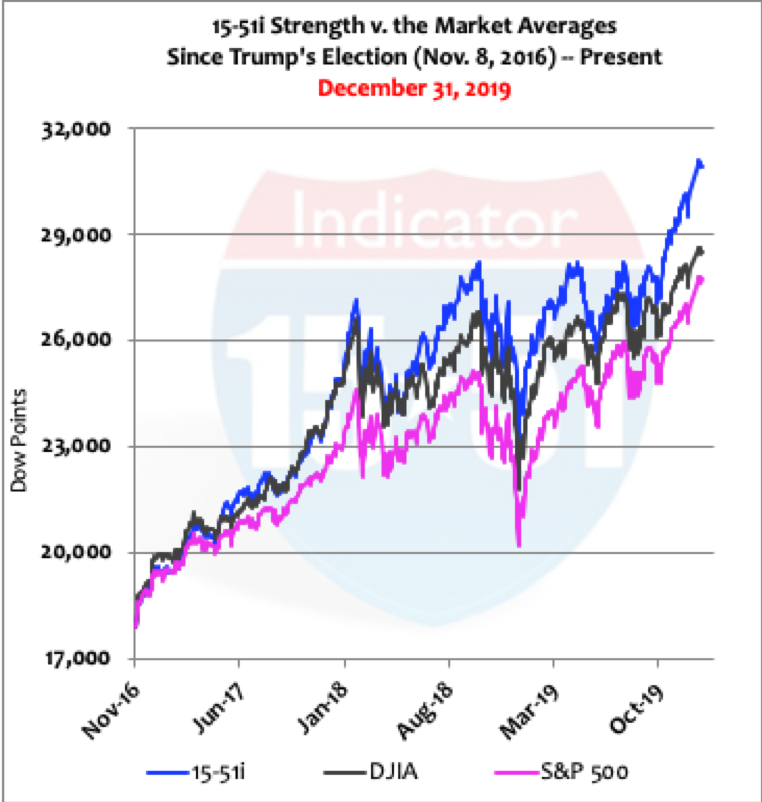
Unlike the one-year chart shown prior, the picture above can be considered “normal” because strength is the highest performing portfolio and the smaller average is ahead of the larger one. That’s the way things should be. But like everything else there are exceptions to the rule. 2019 was one of them. There have been two others.
First it should be noted that it isn’t abnormal when the S&P outperforms the Dow Jones average; that has happened nearly 50% of the time since I’ve been closely tracking my 15-51i portfolio, some 24 years now. Even so the Dow out-gained the S&P during those decades 458% to 425% respectively.
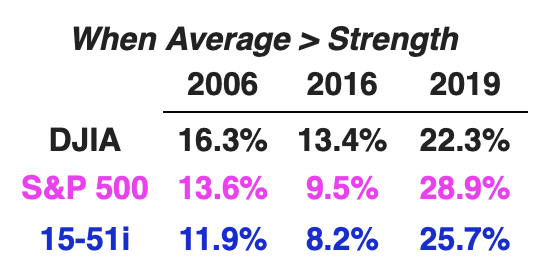
It is a rare occurrence, however, when the S&P average betters stock market strength via the 15-51 Indicator™. Besides 2019 there have been two other years when the S&P 500 outperformed the 15-51i strength indicator: in 2006, one year before the last stock market top (Oct. 2007) and three years before it bottomed (Mar. 2009); and in 2016 when Trump won election (and three years later in 2019 was the third).
Recall that in ‘16 “the market” gained 13% and 64% of it came from election day to the end of that year. In other words, the Trump election produced a short-term burst of broad market inflation (8% return in just two-months’ time) that propelled both Averages passed Strength.
Two of the three times that the S&P 500 outgained my 15-51i portfolio the Dow Jones average had also done it. The only time it didn’t was in 2019, which is an indication that stock market inflation is more widespread now than the other two times. See table below.
Anomalies happen but they shouldn’t happen all the time. If my portfolio began to routinely fall short of the S&P 500 then I would make adjustments to enhance performance because the 15-51 Indicator™ must be an unquestionable above-average performer; and because there is no legitimate reason for a 500 stock average to consistently outperform 15 strong.
Another objective for my portfolio is that I seek to at least double the Dow’s output over 10 years running. This added element is to keep my focus on the long term, and to place a definitive value on performance success.
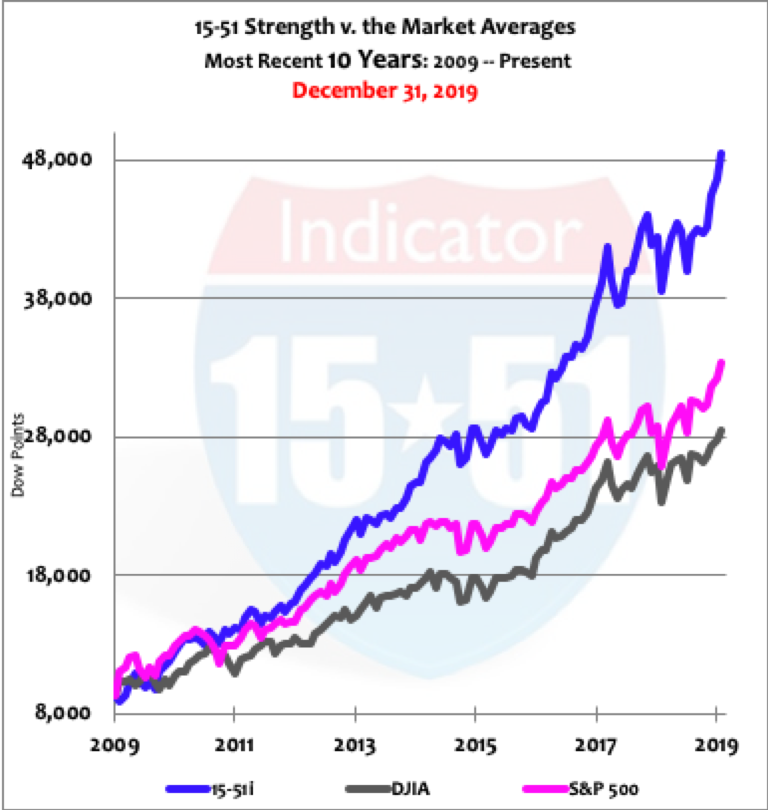
During the most recent 10-year period 15-51i Strength achieved its long-term objectives in movement and performance by producing a rhythmic 420% gain compared to the Dow’s 206% return; the S&P posted a 258% advance. (As a side note, I truly believe the caretakers of the Dow Jones Average – S&P Global– are sabotaging its performance [see: Walgreens – Seriously?]. There’s simply no other explanation for a 500-stock portfolio to consistently outperform one comprised of just 30.)
The reason my portfolio consistently achieves its mission is because I have a solid investment plan that features a winning method, common sense strategies and reasonable tactics that support its mission, and a mechanism to track and evaluate performance, which makes adjusting course both obvious and easy.
There is little doubt having a well-thought plan makes success easier to attain. But nothing provides investors with more comfort and confidence than an intimate knowledge of their portfolio’s components (i.e. stocks), their method of assembly (i.e. 15-51™), and how they relate to “the market.” (See my book for more details.)
The point here is simple: You can’t eat pizza, drink beer, and watch TV every chance you get and become a world-class athlete. Strategies and tactics must be consistent with the objective in order to achieve success. Exercise and a healthy diet is a good place to start this New Year.
Plan your work and work your plan.
You can do it.
Stay tuned…
![]()
[…] my 15-51i portfolio will continue to reliably outperform base model portfolios because it is regularly maintained to keep pace with the ever changing environment, and the wear and tear reality may […]