The importance of employing a well-defined method of allocation cannot be oversold. It makes everything so much easier, from stock selection to decision making, to understanding how your portfolio will behave under any market condition.
The reason many consider the stock market to be scary is because they have no idea what to expect from “the market” or their portfolio. Indeed, stock market activity can surprise anyone. But the behavior of your portfolio should never.
For instance, because my portfolio is “market diversified” I know it will move with the same rhythm as “the market” does, and because it is built with my superior method and 15-51™ design, I am sure it will outperform the Market Averages in the same way a world class athlete dominates a couch potato.
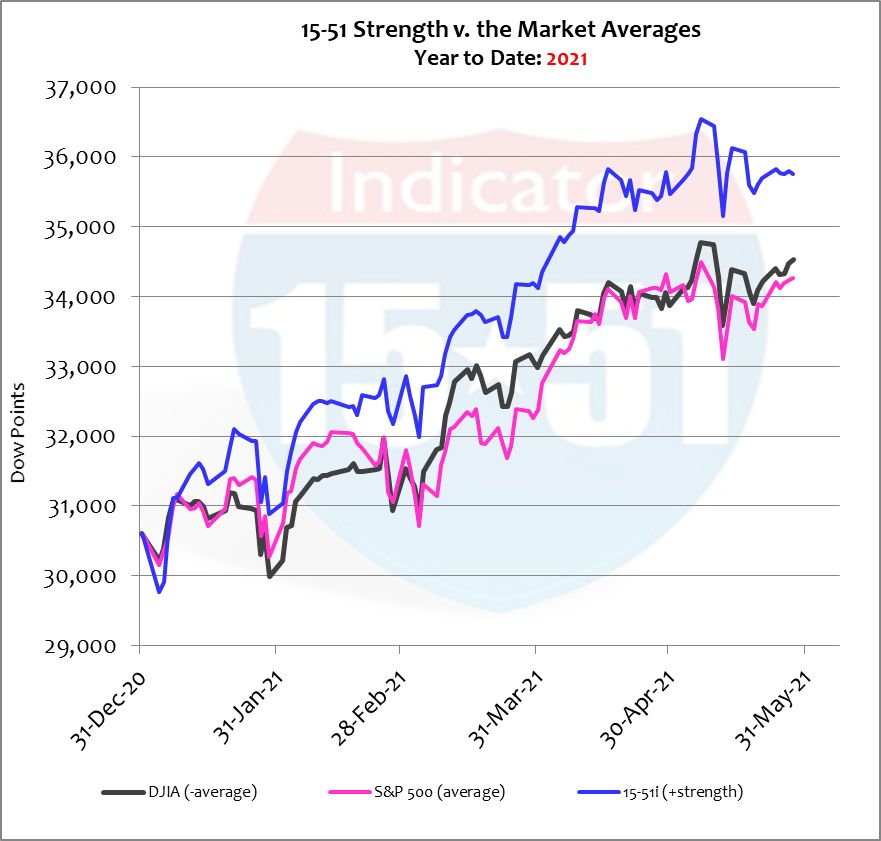
The definition of strength is not subjective. It is above-average or some superior performance compared to the normal state of average. My 15-51i portfolio is expected to move stronger to upside during rising markets and fall less during declining markets because it is built with better structural design than the Market Averages. In other words, it is designed and constructed to be stronger than the market standard.
The greatest measurement of stock market strength is return on investment (ROI), a.k.a. profit, because it is impossible to see strength in loss and it is hard to notice it in breakeven. Profit is had by buying low and selling high. And as a result, strength can be appreciated not only through gain but also by the way an investment pursues that objective, depicted by the manner in which an investment moves in up markets and down.
So how does that look?

As you can see in the chart above, strength can be appreciated in both overall gain and movement, as my 15-51i portfolio (blue line) falls less, rebounds faster, and consistently builds higher-highs while moving with the same heartbeat as “the market”. So far this year 15-51i Strength has gained 17% while the Dow Average added 13%, and the S&P 500 advanced 12%.
That is how the 15-51 Indicator™ was designed and constructed to perform. And when it doesn’t perform as imagined, well, then that’s a good time to make modifications to it. In other words, portfolio behavior highlights when and if a problem exists that needs corrective action.
The behavior or your portfolio should match the reliability of your best friend.
For example, from the end point shown above imagine the Market Averages moving in the shape of the letter N for the next two months. Where do you think the trend for my 15-51i portfolio would end after that time?
That’s the power of knowing, and the familiarity that comes along with it.
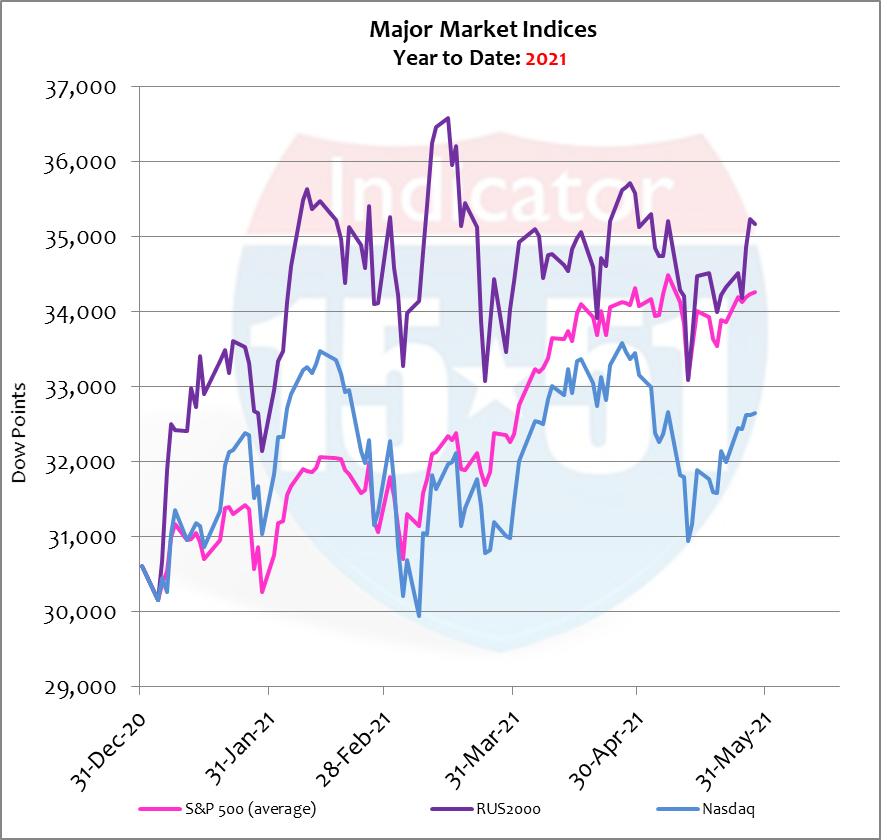
Now to the contrary, and as mentioned in my prior blog, the NASDAQ and Russell 2000 only loosely attempt to market diversify, as the NASDAQ is heavily over-weighted in technology stocks and the Russell is heavily over-weighted in the market’s highest risk segment (small cap stocks) which is also heavily populated with technology stocks. And because of this, neither portfolio moves in a “market-like” way. See below.

Where would either non-market portfolio end should “the market” move as the shape of the letter N over the next two months?
Your guess is as good as mine.
That’s the benefit of employing a well-defined method of allocation in a nutshell – knowing how your portfolio will behave in any market condition.
The Russell and NASDAQ aren’t market portfolios so they don’t act like one, nor should they be expected to act like one.
Take the mystery out of investing and build your portfolio with purpose – and make it is easy by employing the sleek and powerful 15-51™ system.
Stay tuned…


[…] 1990’s, demonstrates the investment process by using my stock selection method and patent-pending 15-51™ allocation system. My method follows basic logic and common sense, and when directed to achieve a specific purpose, […]